
Live Streaming Operations

Objective
To streamline and enhance the live streaming experience for various operation teams at Warner Bros. Discovery.
The Challenges
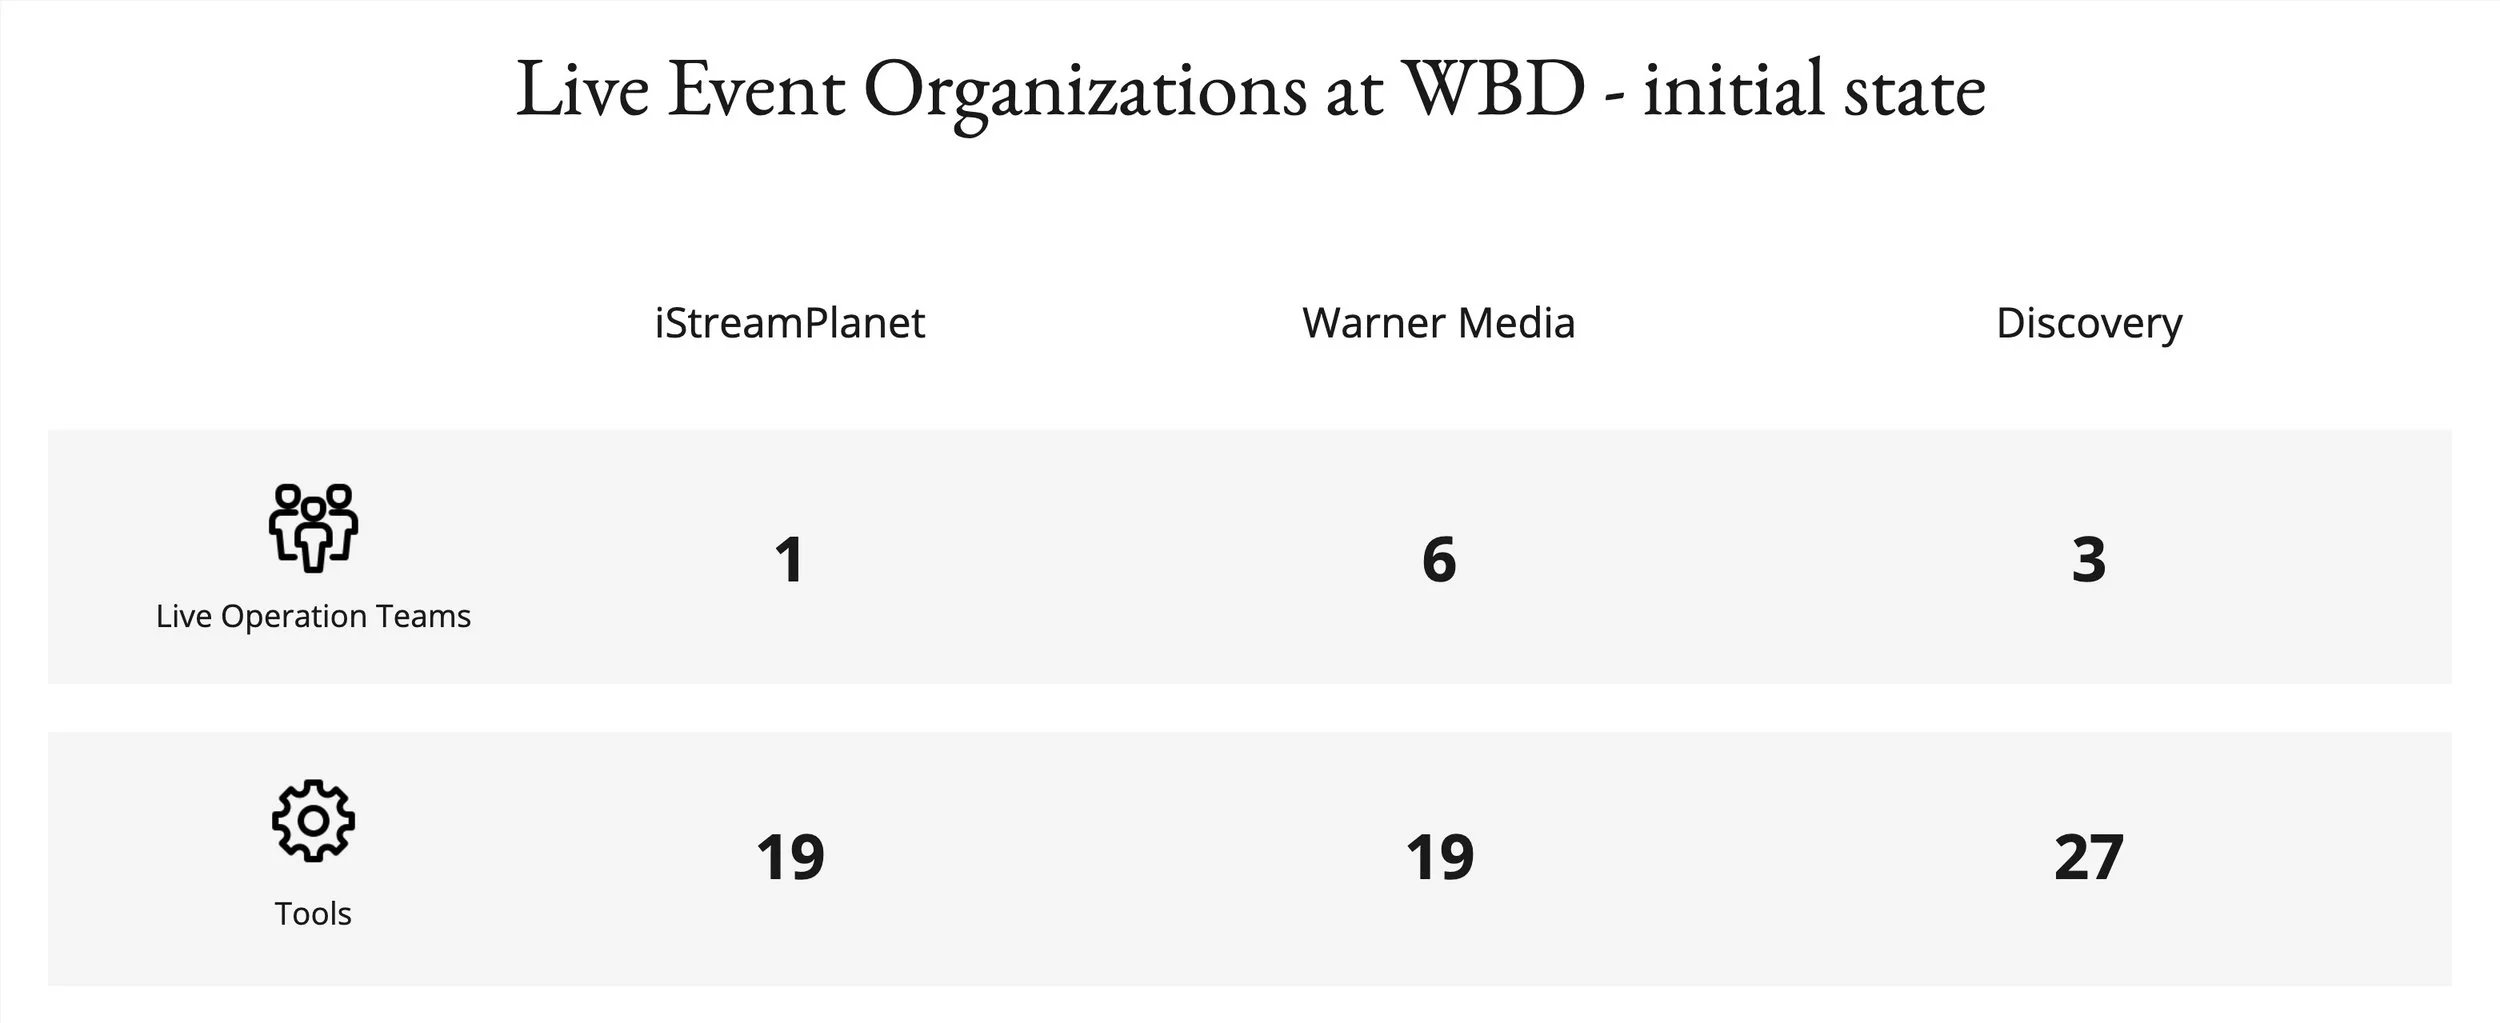
In a dynamic media landscape, Warner Bros. Discovery faced a fragmented approach to live streaming operations. Coming from different organizations, multiple teams used disparate tools and different processes, leading to inefficiencies, redundancies and inconsistencies.
My first challenge was to unify all the operation tools within the iStreamPlanet organization.
Once Discovery and Warner Media merged, it became clear to include all the teams, from all parts of the organization: iStreamPlanet (iSP), Warner Media and Discovery. Same challenge, but exponentially bigger.
Strategic Leadership and Vision
As the lead product designer, I was responsible for steering the project from conceptualization to execution and my role included:
At first spending time learning and quickly improving existing tools within iSP.
Then collaboratively defining the project scope and objectives with cross-functional teams.
Leading user research activities to deeply understand the users’ journeys, and their different objectives.
Developing a strategic vision for a unified live streaming operations platform.
Impact and Results
Worked with engineering teams to quickly resolve ongoing issues with different tools, like the Source management application, or creating a way to manage the slates.
Created a more efficient experience for users to run live events, initially for iSP then for max (before its release and replacement of HBOmax). This work received praises from the entire organization.
Crafted a product vision prototype based on research data and participatory workshops with users.
Increased operation efficiency by reducing the number of tools and creating a more seamless experience.
Being completely new to this industry was a challenge, but also an opportunity to learn. To familiarize myself with this new field, I read recommended articles and met with technical engineers, operators, producers, people building tools, and use tools. I then took the initiative to meet with the operation team at iStreamPlanet, and reproduced more or less the same format with the other teams.
Research
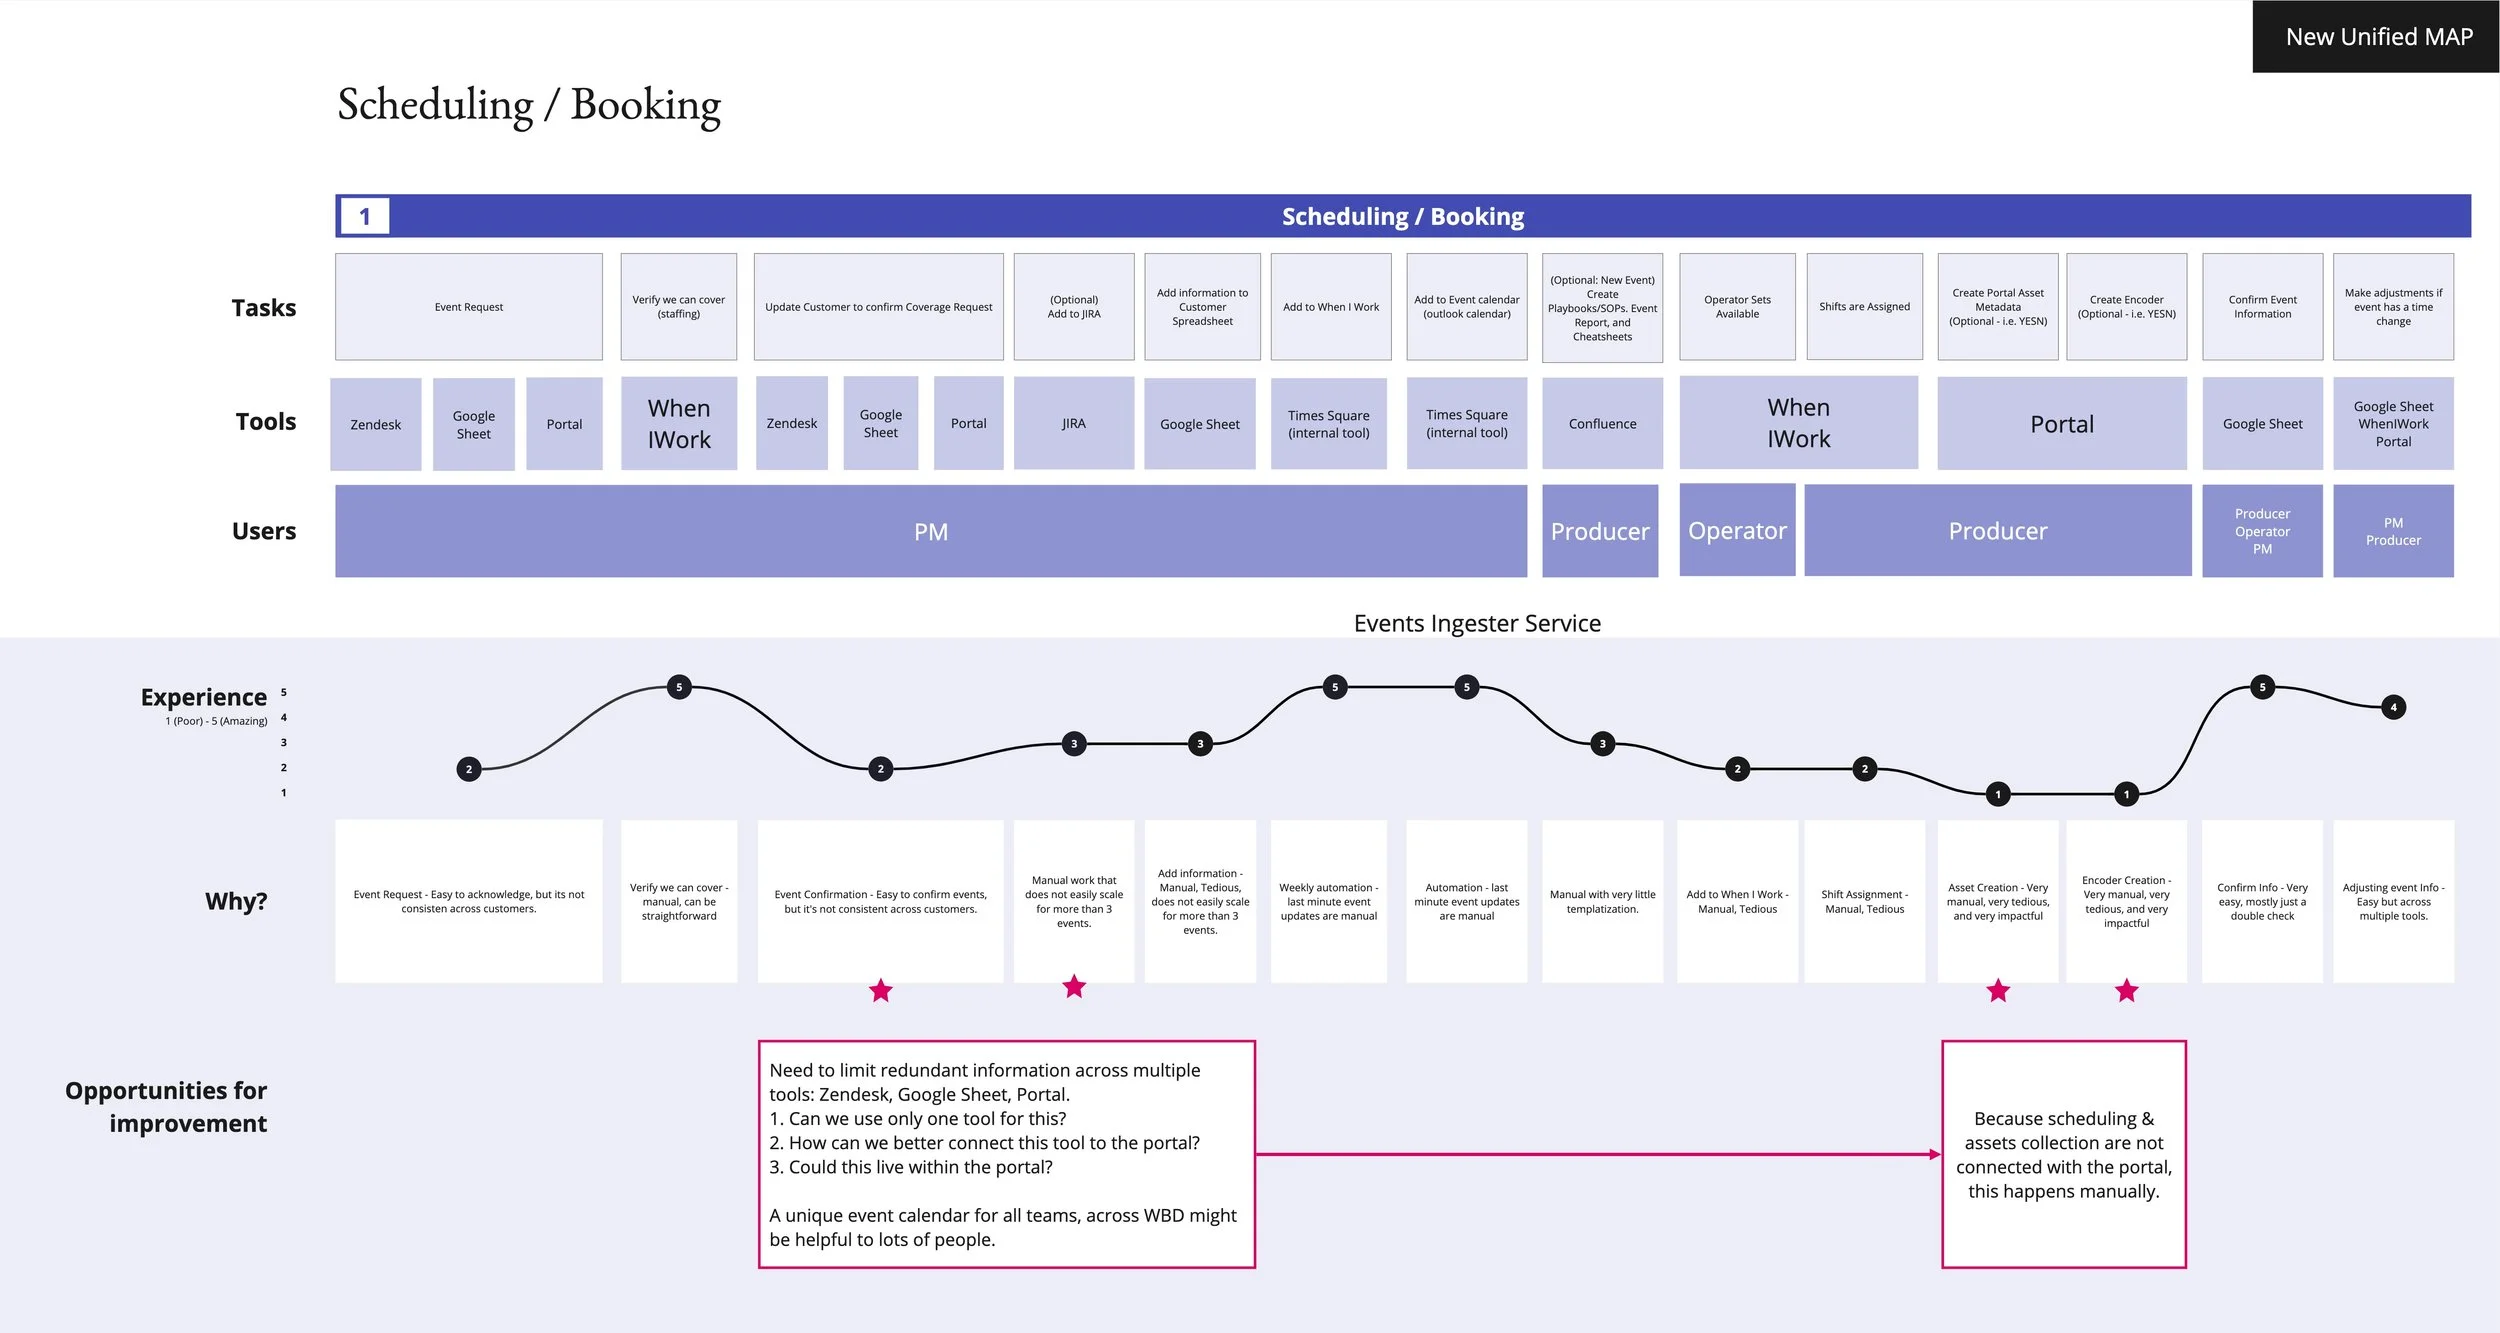
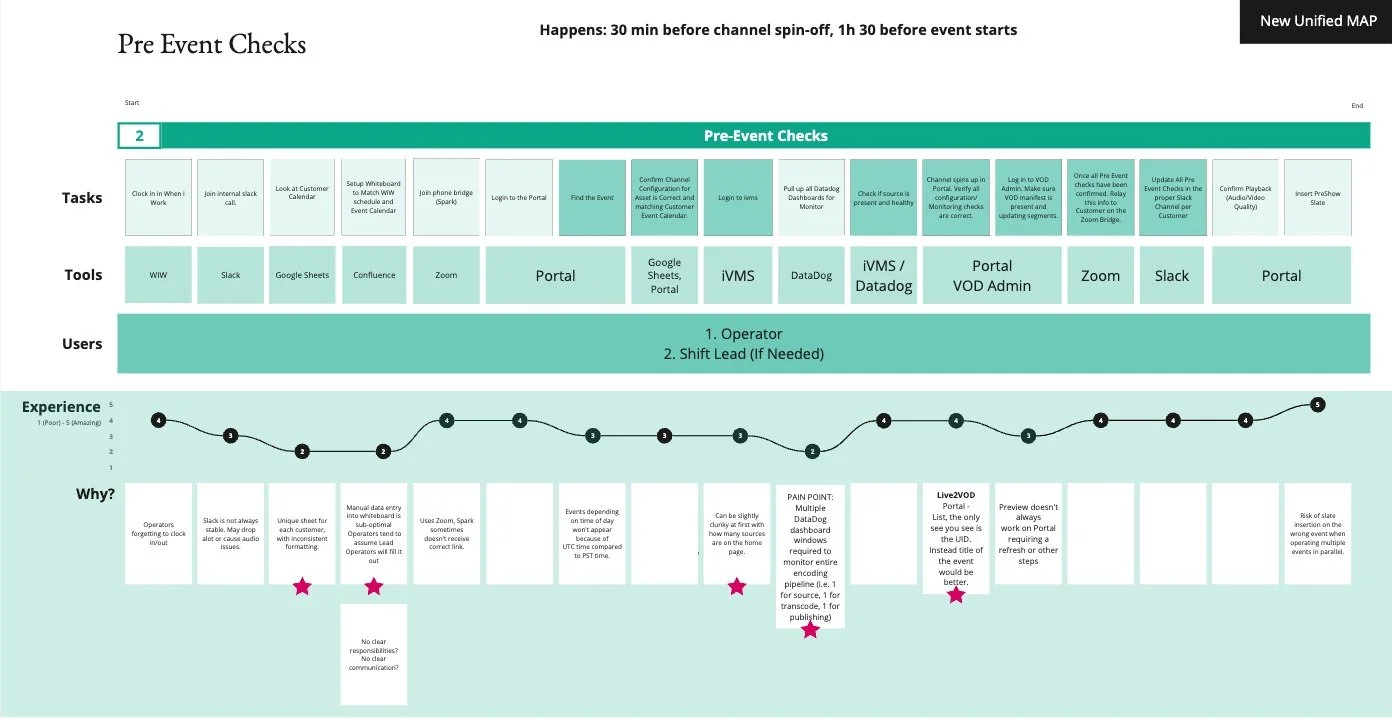
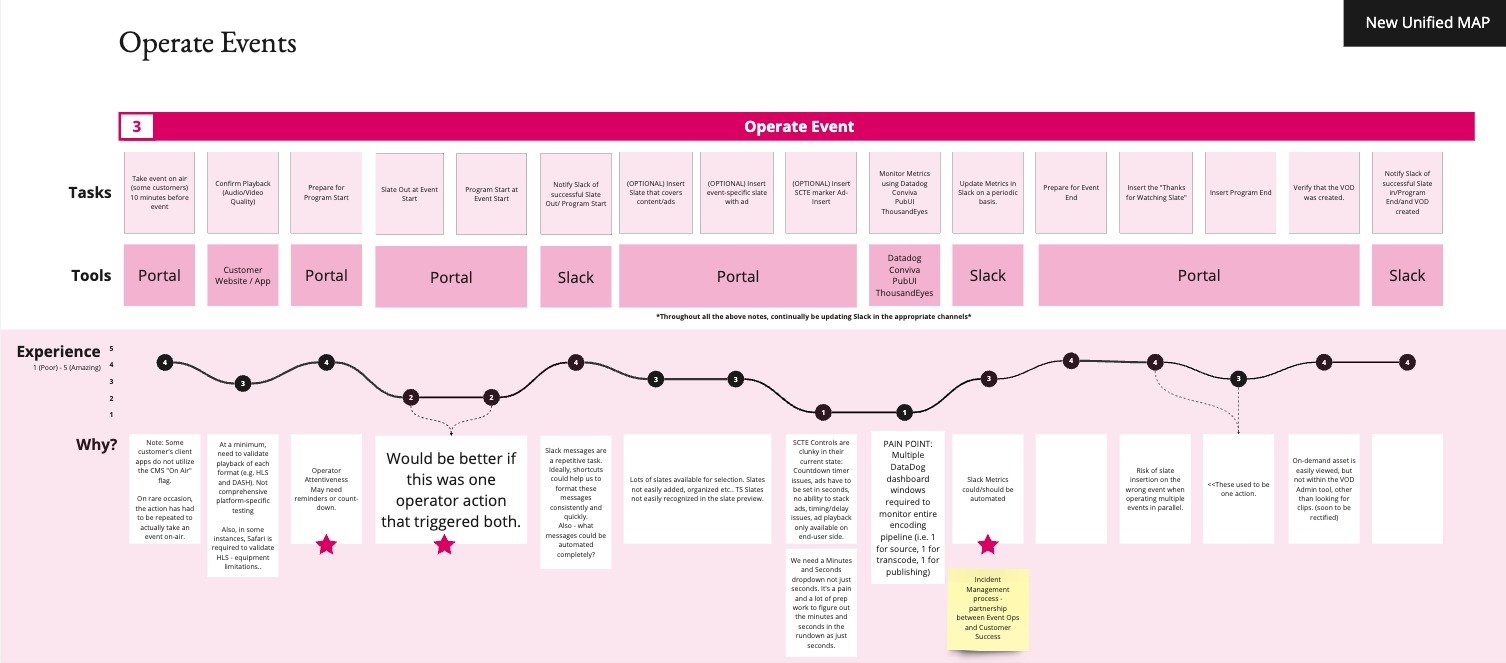
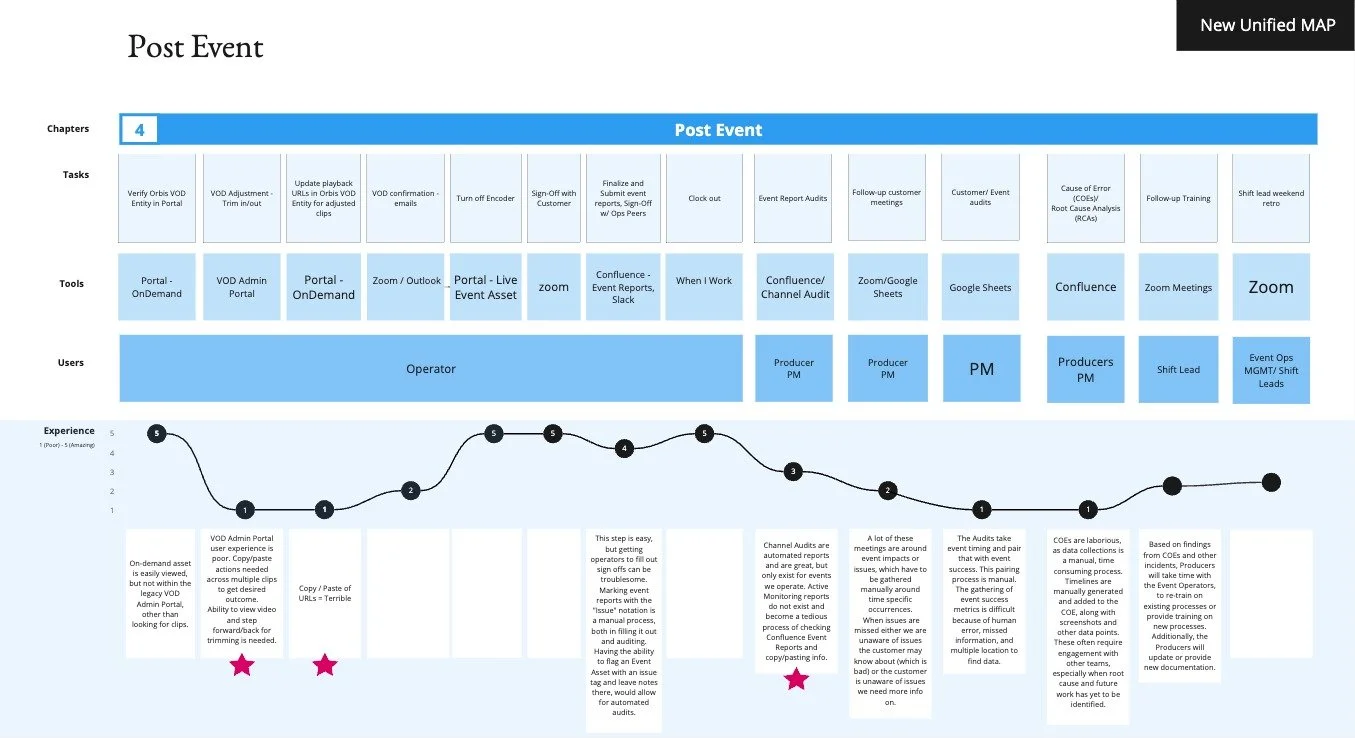
To fully grasp the diversity of processes and needs I organized interviews and workshops with all the teams, capturing their operational approaches to running events, highlighting individual tasks, the tools they used, and documented their positive and negative experiences.
With each team, we organized the live event experience journey in four chapters:
Scheduling
Pre-event checks
Live Operation
Post-event
Challenges
1) Documenting teams’ workflows was first perceived as a performance review. I wanted to understand what worked and what didn’t work, and as a consequence they felt judged, and even threatened.
2) It was not ideal because I wasn’t able to observe on the field what was happening. All the sessions were remote using Miro.
3) Because of each team’s schedule and availability I couldn’t reproduce the exact same format with each of them.
4) The research took several months to be completed, I had to adapt to their priorities.
Learnings
1) I had to adapt to every situation to make the most out of each time spent with users, and numerous follow-ups were needed, via Slack, email, or additional sessions.
2) The teams started to really enjoy these sessions, because they understood that I was there to help them, not judge them.
3) Workshops, in particular, became a sort of a retrospective session where they would imagine new solutions, and recognize their weaknesses.
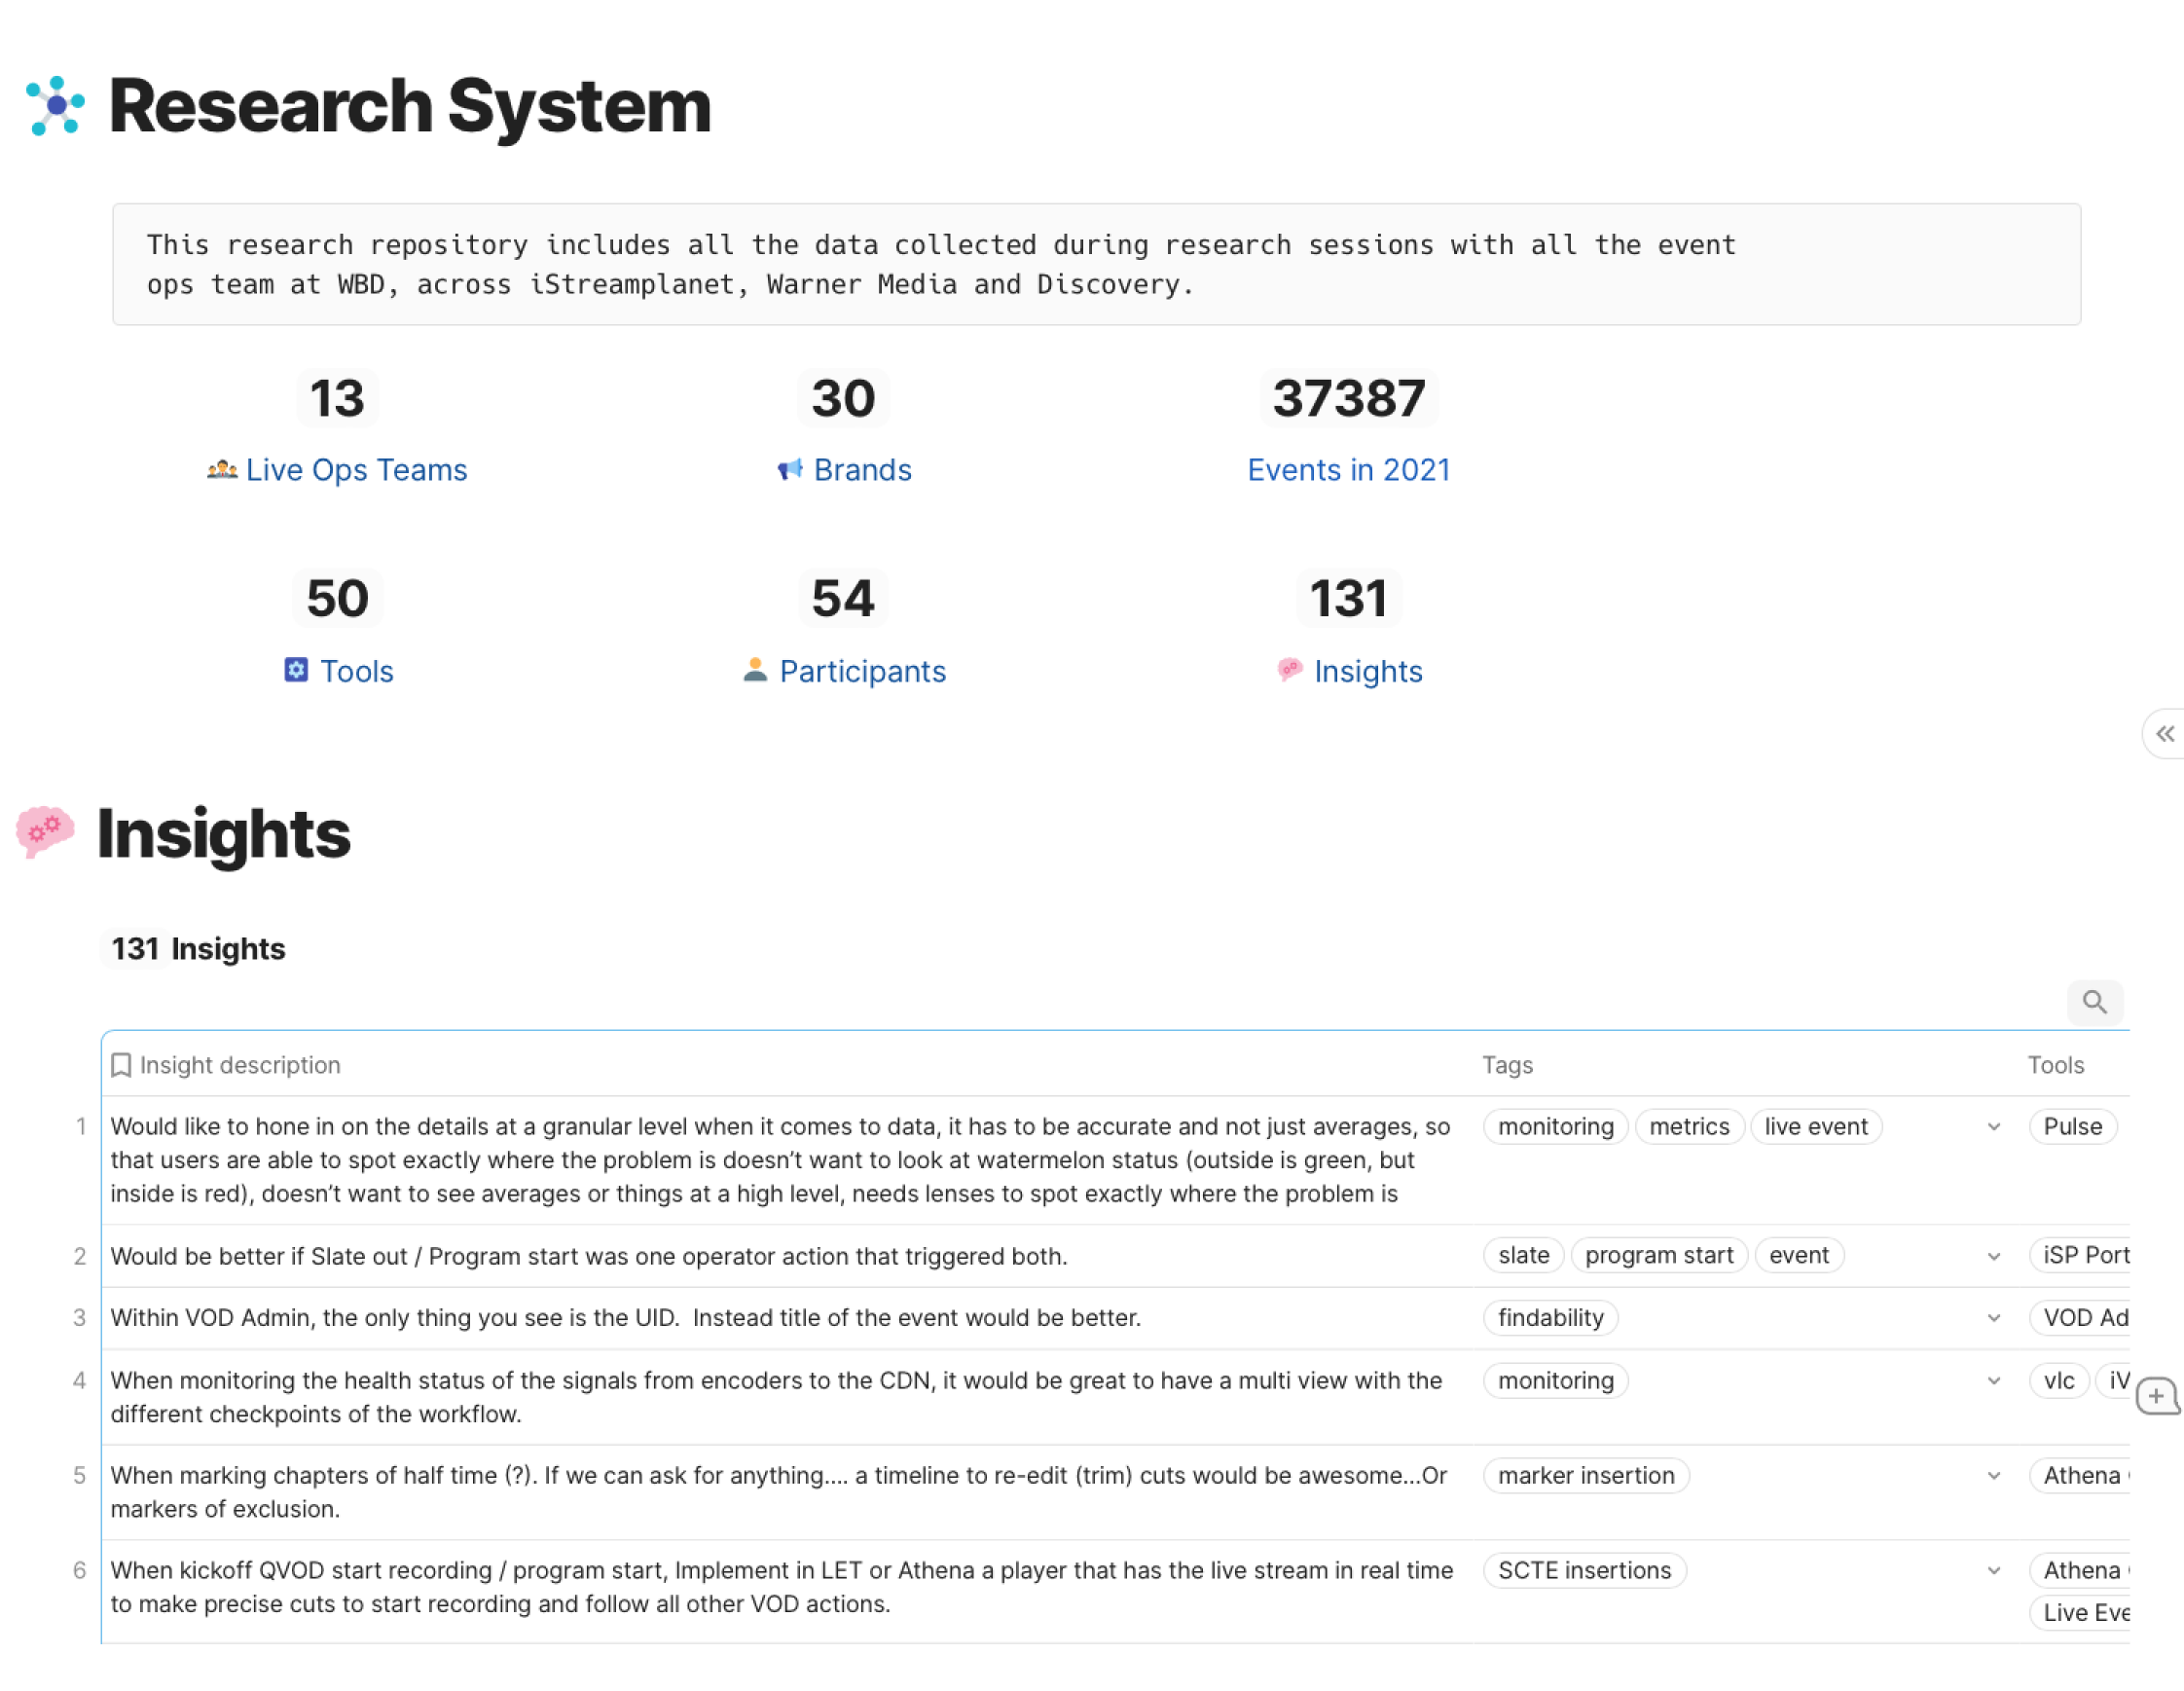
To better manage the research data, I created a research repository, using coda.io so that as a team we could better analyze and understand our users’ workflows and needs. Like the previous research systems I had created at Illumina and Genepeeks, I used some principles learned from Tomer Sharon with Polaris.
This Insights table shows ideas captured during workshops, or 1:1 user interviews. Sometimes they would take the form of a suggestion, a frustration, a positive feedback or just a description of how things work. The system also included tables listing the teams, the brands they supported, the tools they used, the different user roles, etc…
Challenges
1) Nobody really cared about research data in general in our department but I knew that if I wanted people to consume this I would have to come up with an easier way than presentations, or Google Docs.
2) Although I had worked with research repositories before I wasn’t sure which tool to use, so I tried a few such as EnjoyHQ, Condens, and Dovetail before choosing Coda.
3) Although I didn’t ask for permission I had to make it official, so I went through a series of permission requests after the fact.
Learnings
1) Organizing research data helps understanding. You find similarities, patterns, and differences.
2) Presenting the data and explain how it might help improve the operation experience was each time key moments for people, including myself.
3) I created a simplified form for anyone to use so that we would collect more data, but in the end it was only three people adding and managing data, two designers and one director of product management who was also leading an operation team.
Redefining Live Operation at iStreamPlanet
During the first six months, I learned about live operation, interviewing stakeholders and users, and started to make some impact in solving ongoing issues teams had with a few applications.
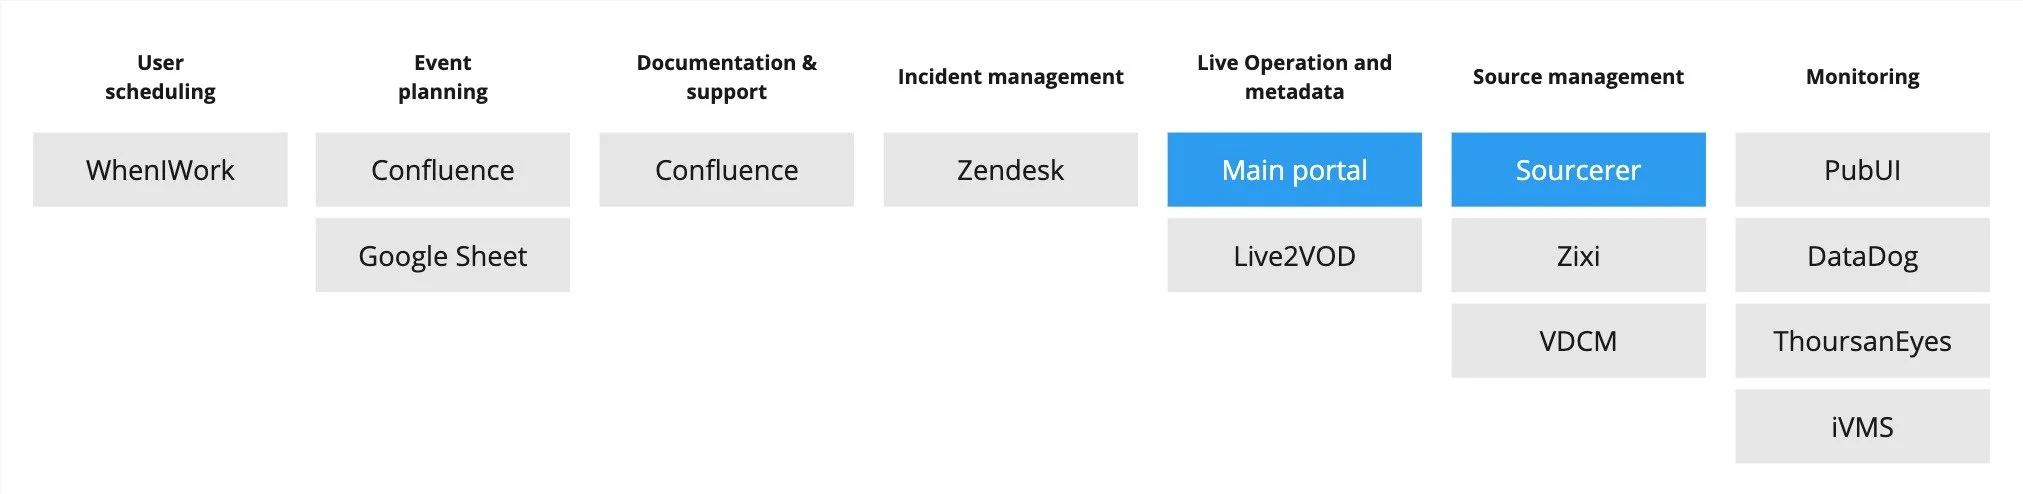
To make each live event a reality teams needed to use a lot of different tools… some of them had been built internally, and the rest were third party products.
I started by working on a couple of those: the Main Portal, and Sourcerer.
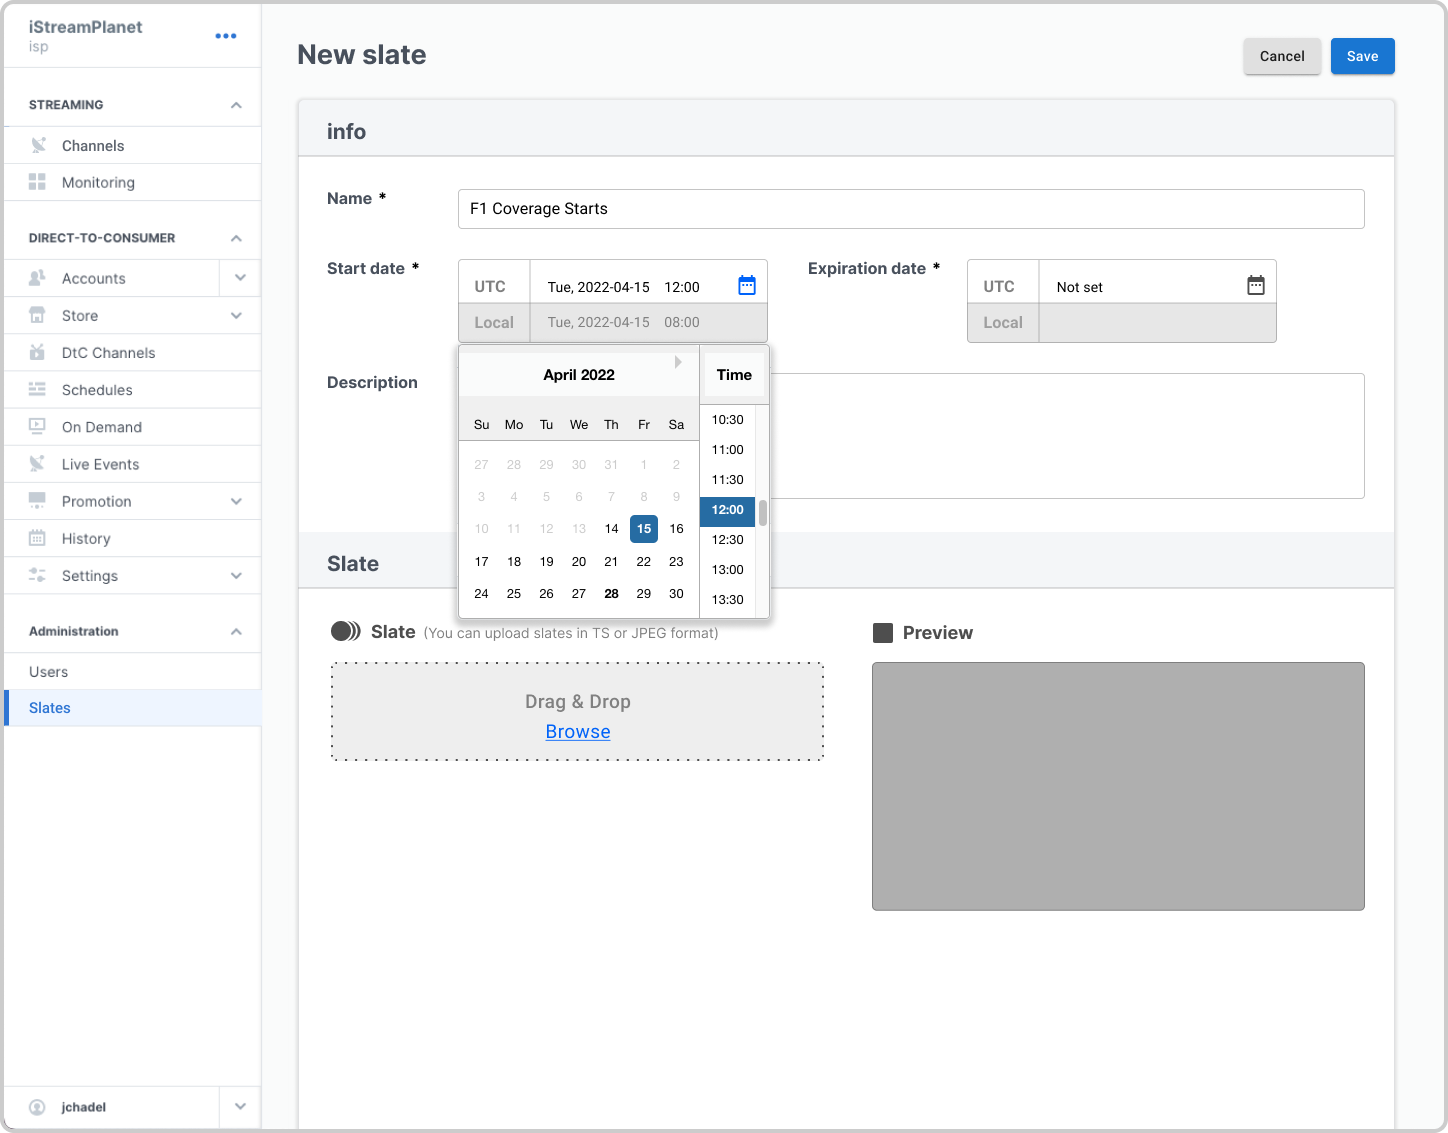
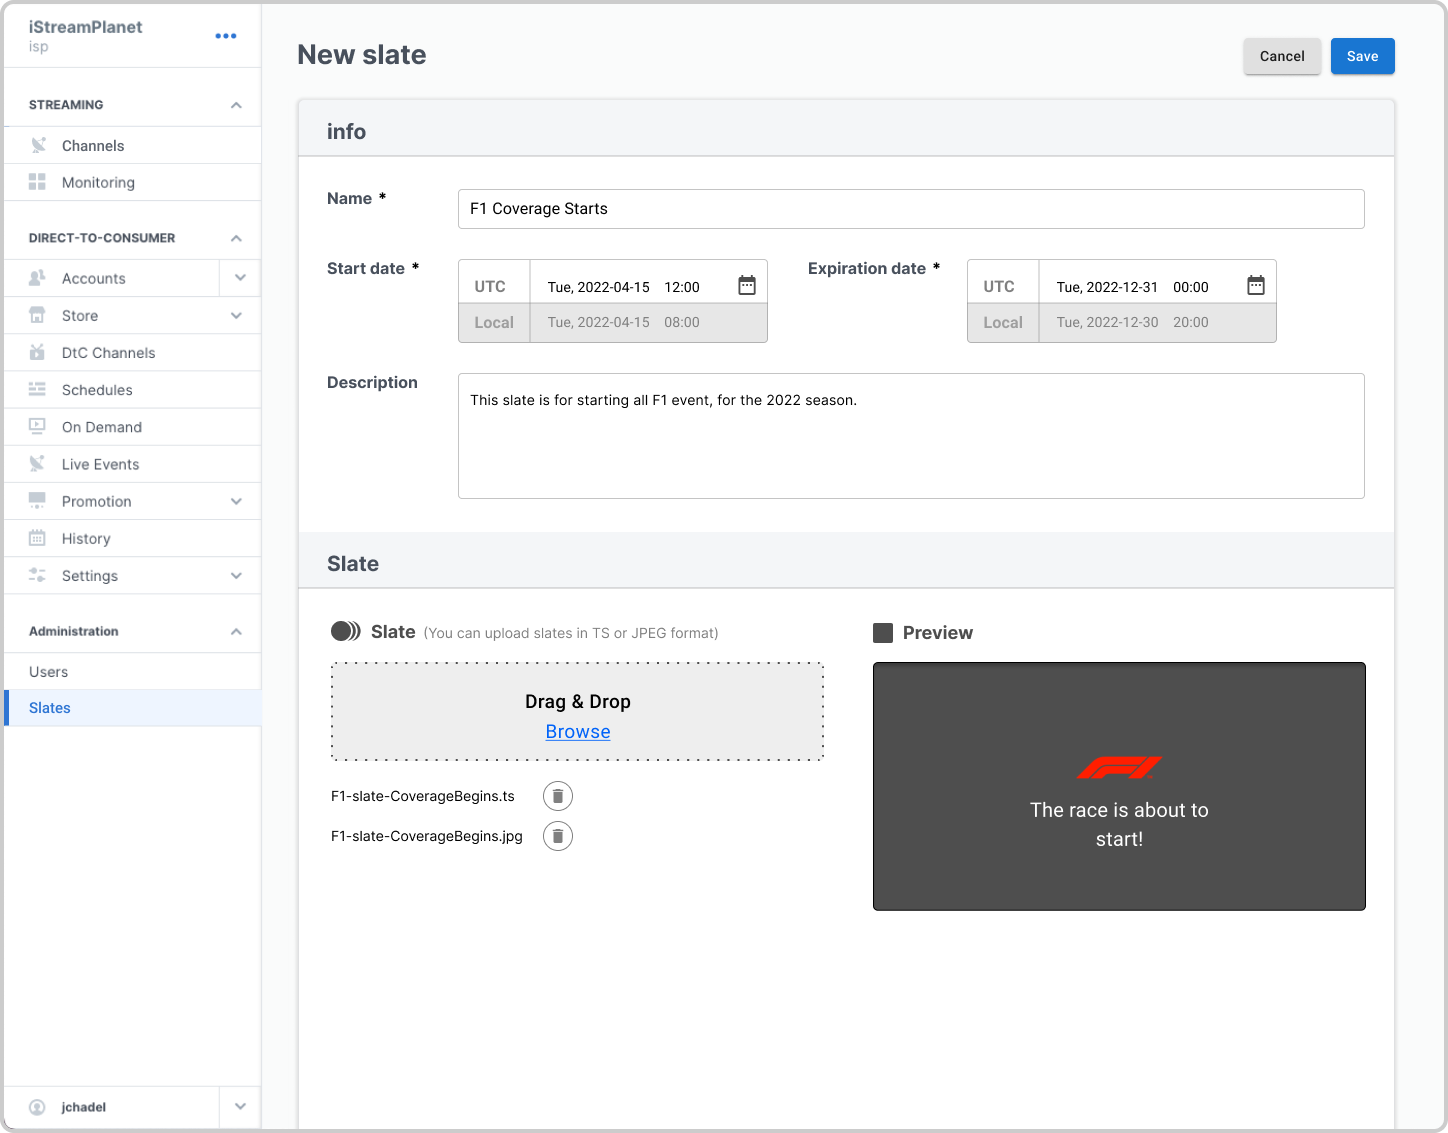
Slates management
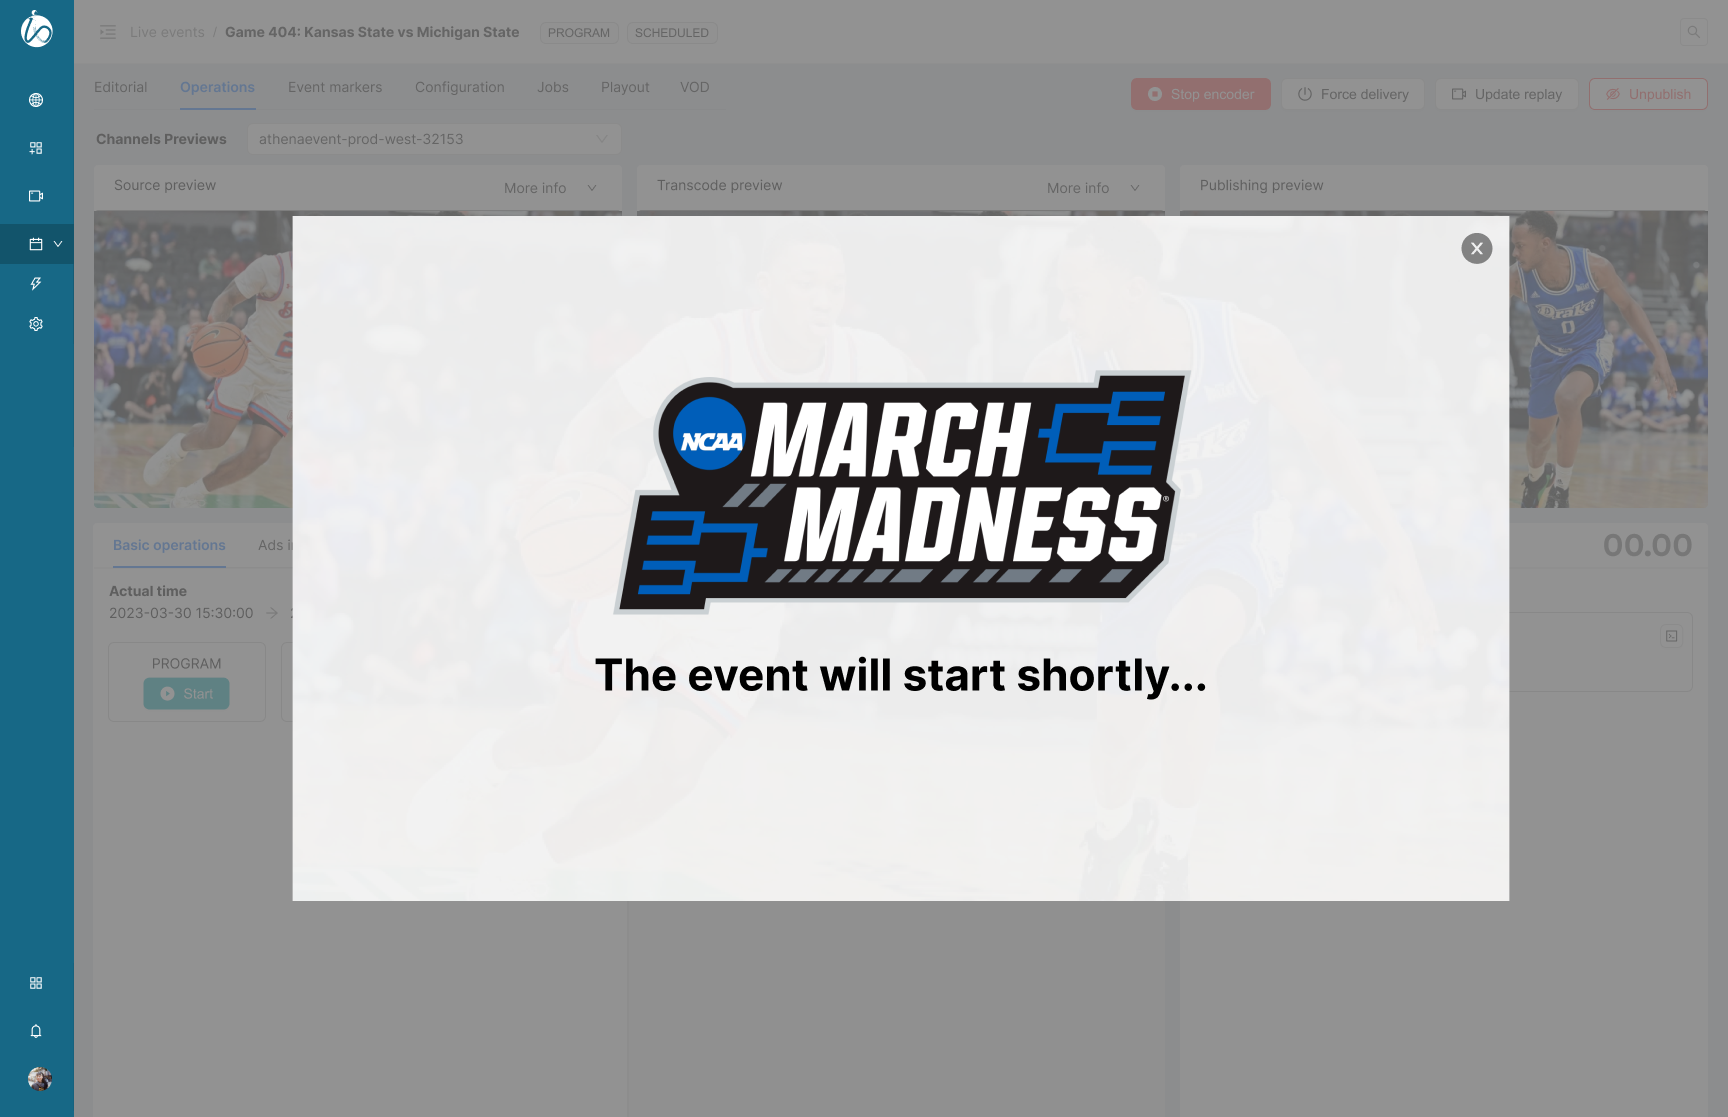
One issue operators had was the inability to set up and manage slates efficiently before and during events. A slate is an image or short video displayed before, during or after an event that is communicating a message to consumers, such has “the event is about to start”, “we are facing a technical issue”, etc…
For each event, the slates URL would be saved in Confluence, and the URL would be copied and pasted to the main portal during the event, that’s it.
I worked with a product manager, an engineering team and users to make that experience much more efficient, while using the existing portal - I was not allowed at that time to change the design.
Old portal improvements
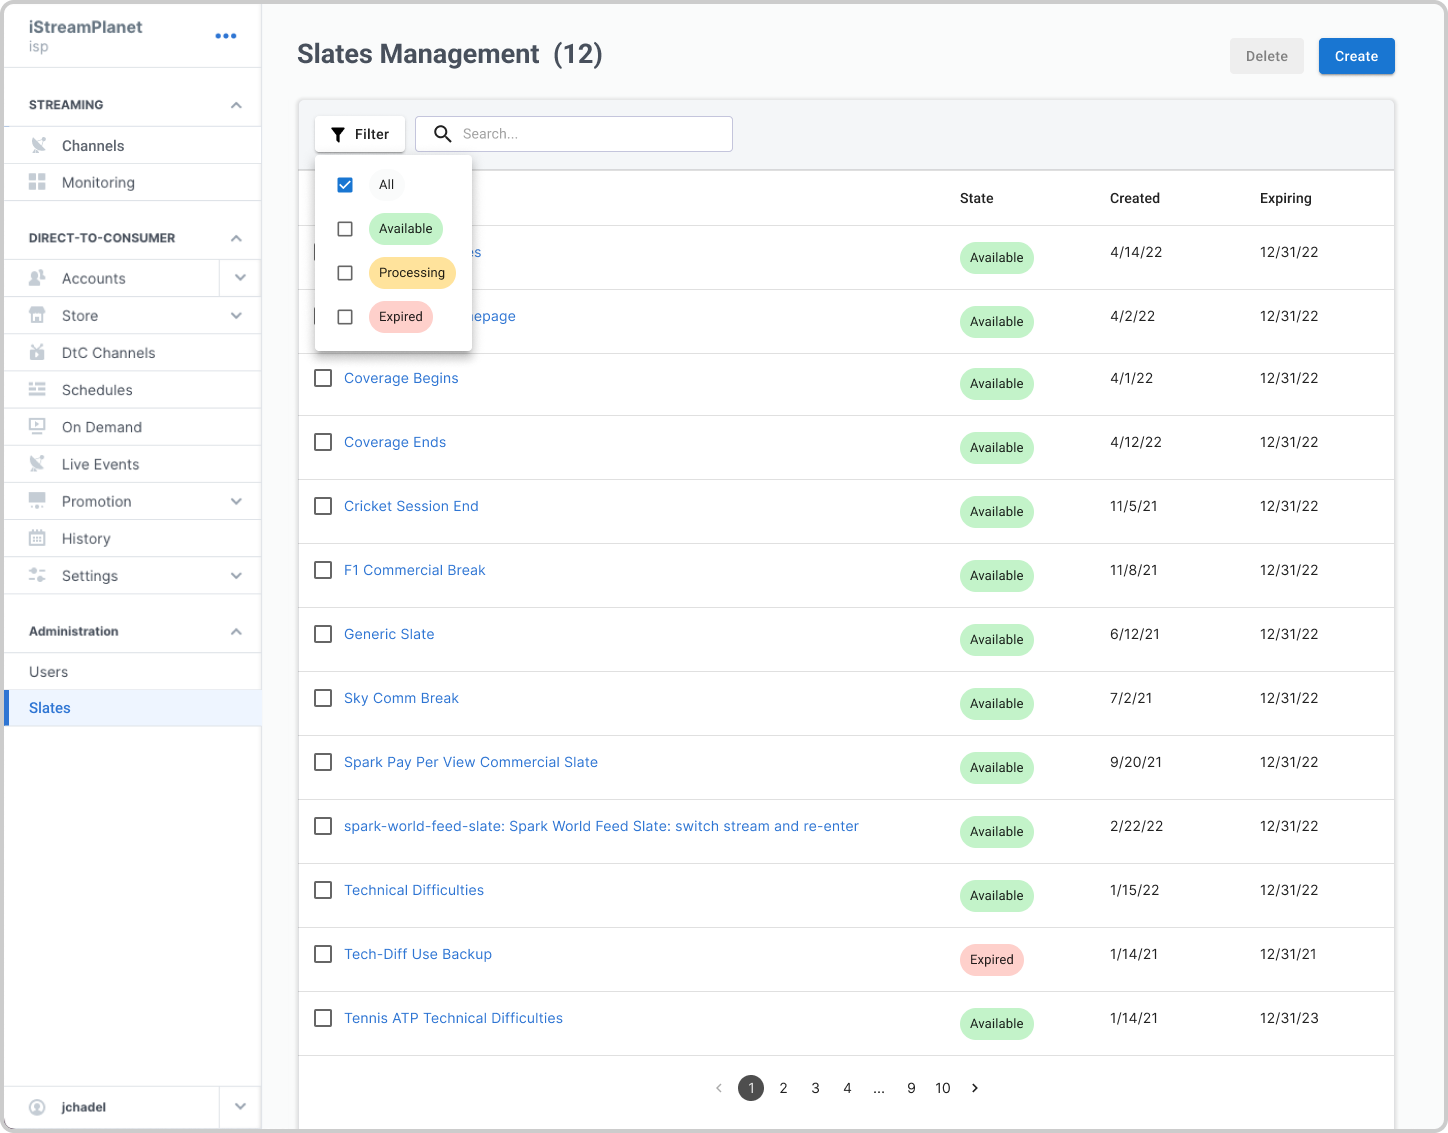
Added search, and filters
Slate setup (was manual via email before)
Sourcerer and VSS
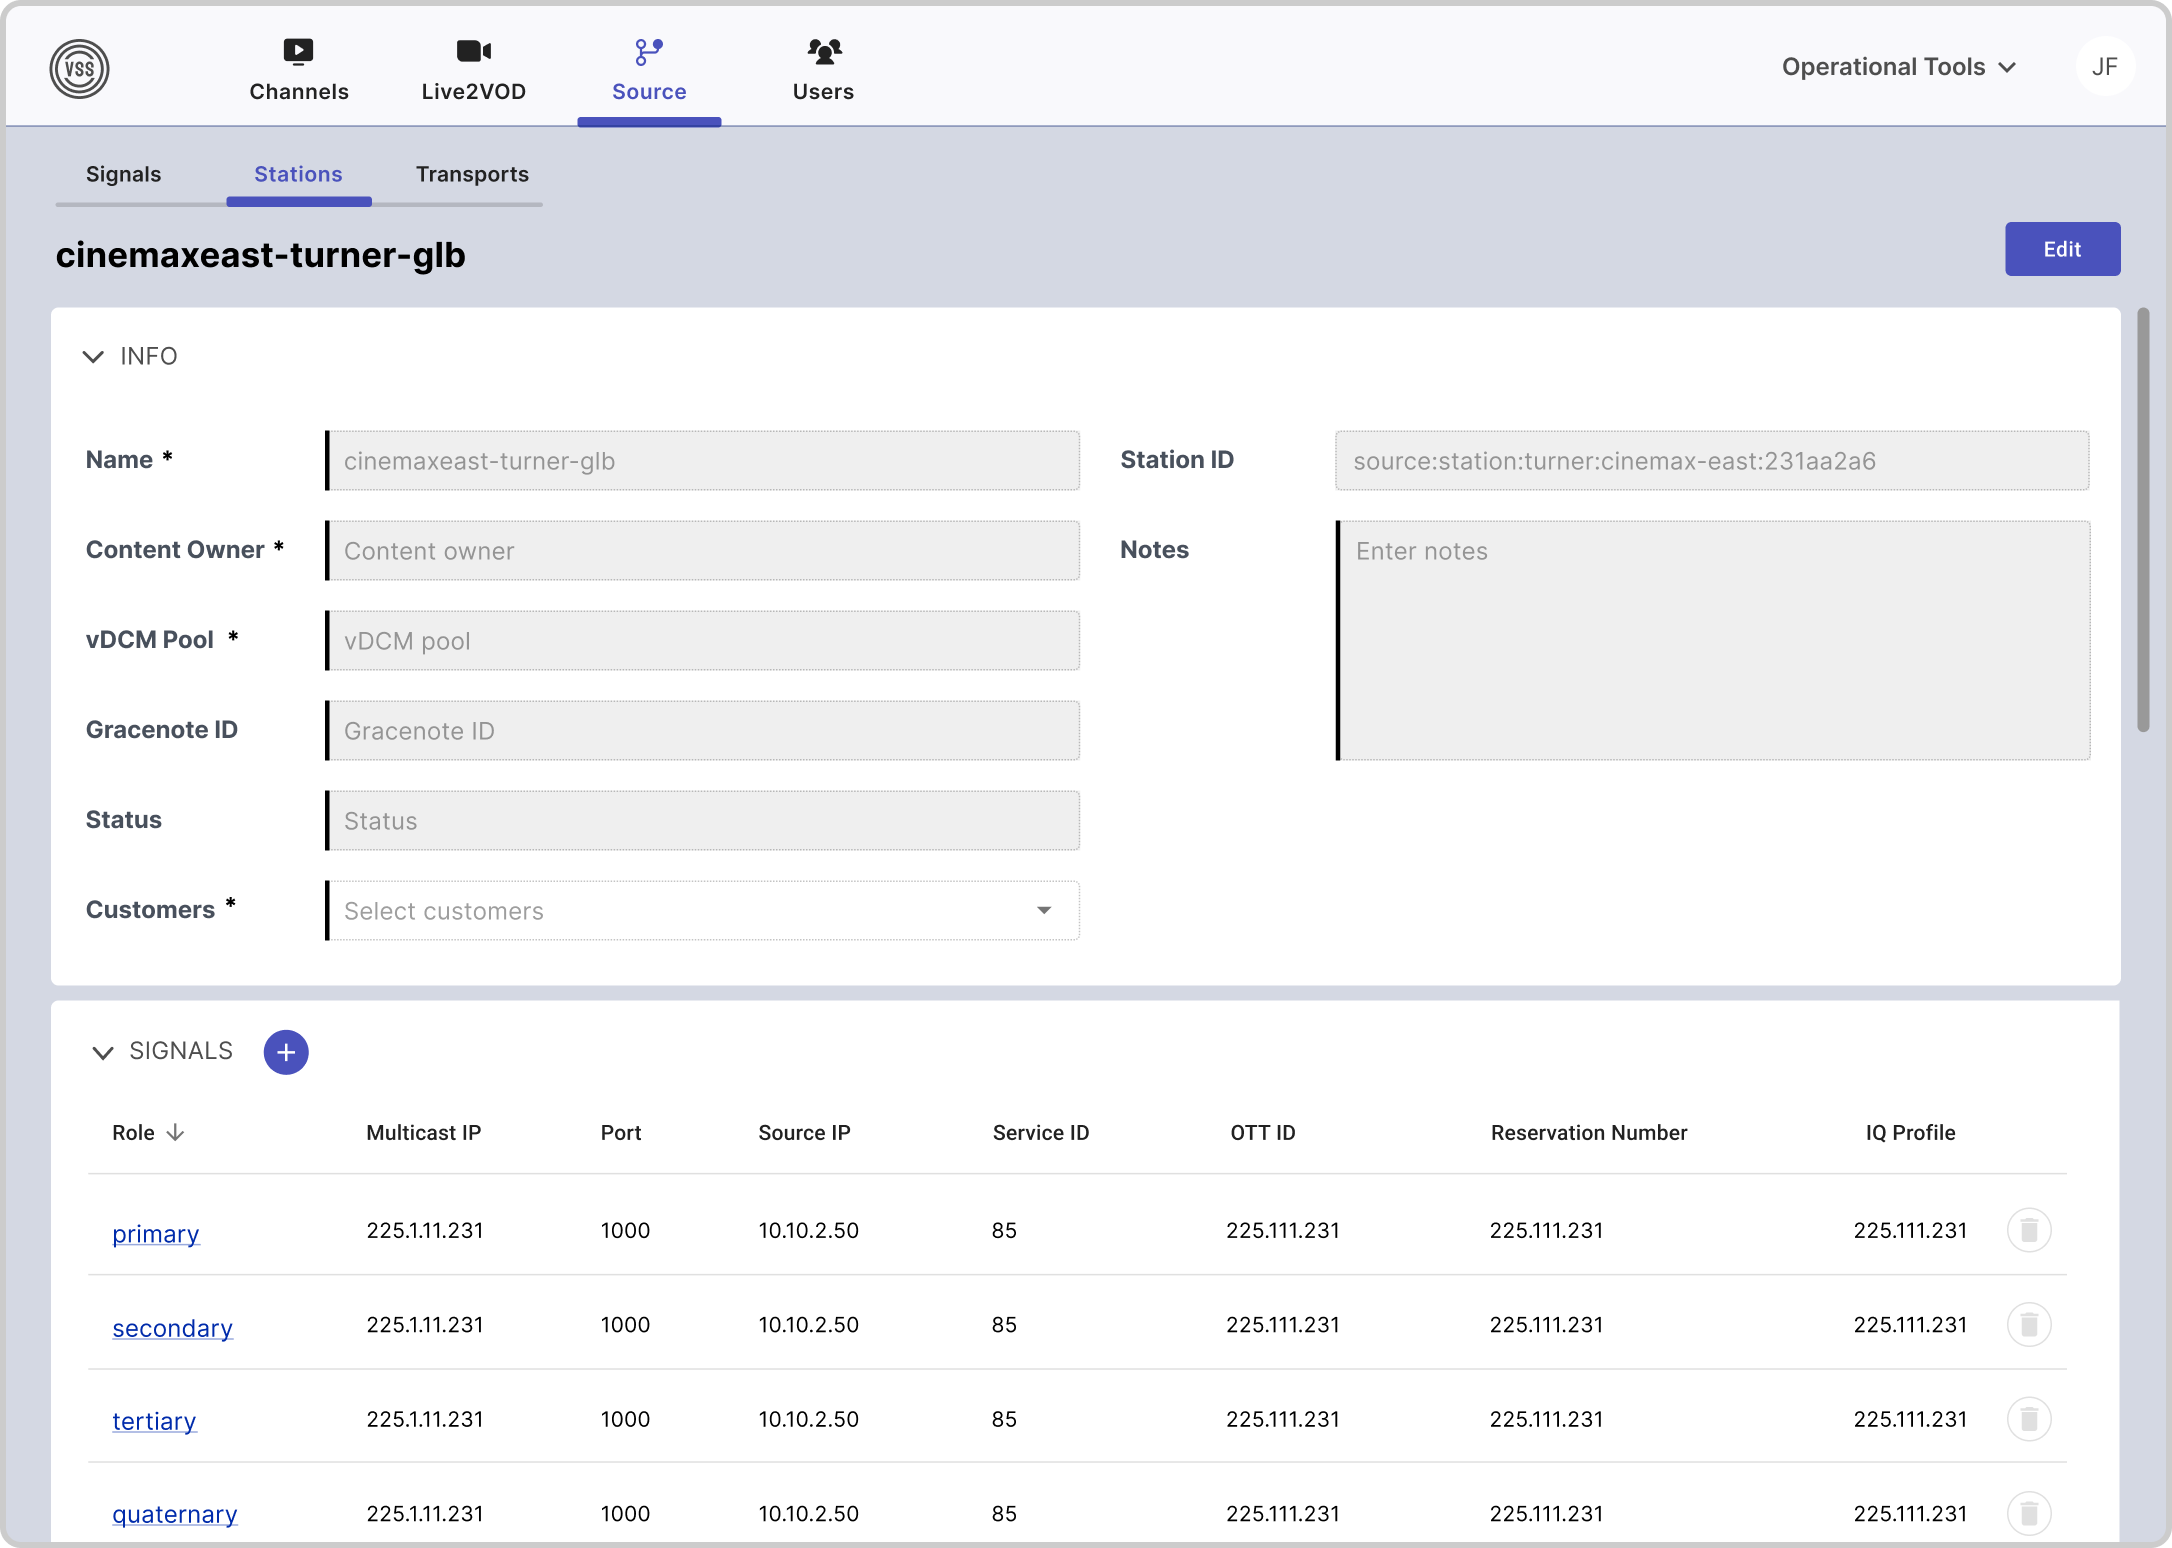
The Source team was responsible to manage and configure the audio and video source signals sent live from the field. They were using 4 different tools. I consolidated the experience into 1 app.
One of the main pain point was the creation and edition of stations which required repetitive steps and multiple copy & paste from one tool to another or from pages to pages. Surprising but true!
The designs below simplified navigation between key entities (Signals, Stations and Transports), reduced the number of errors, improved the efficiency of managing stations and introduced a temporary new portal.
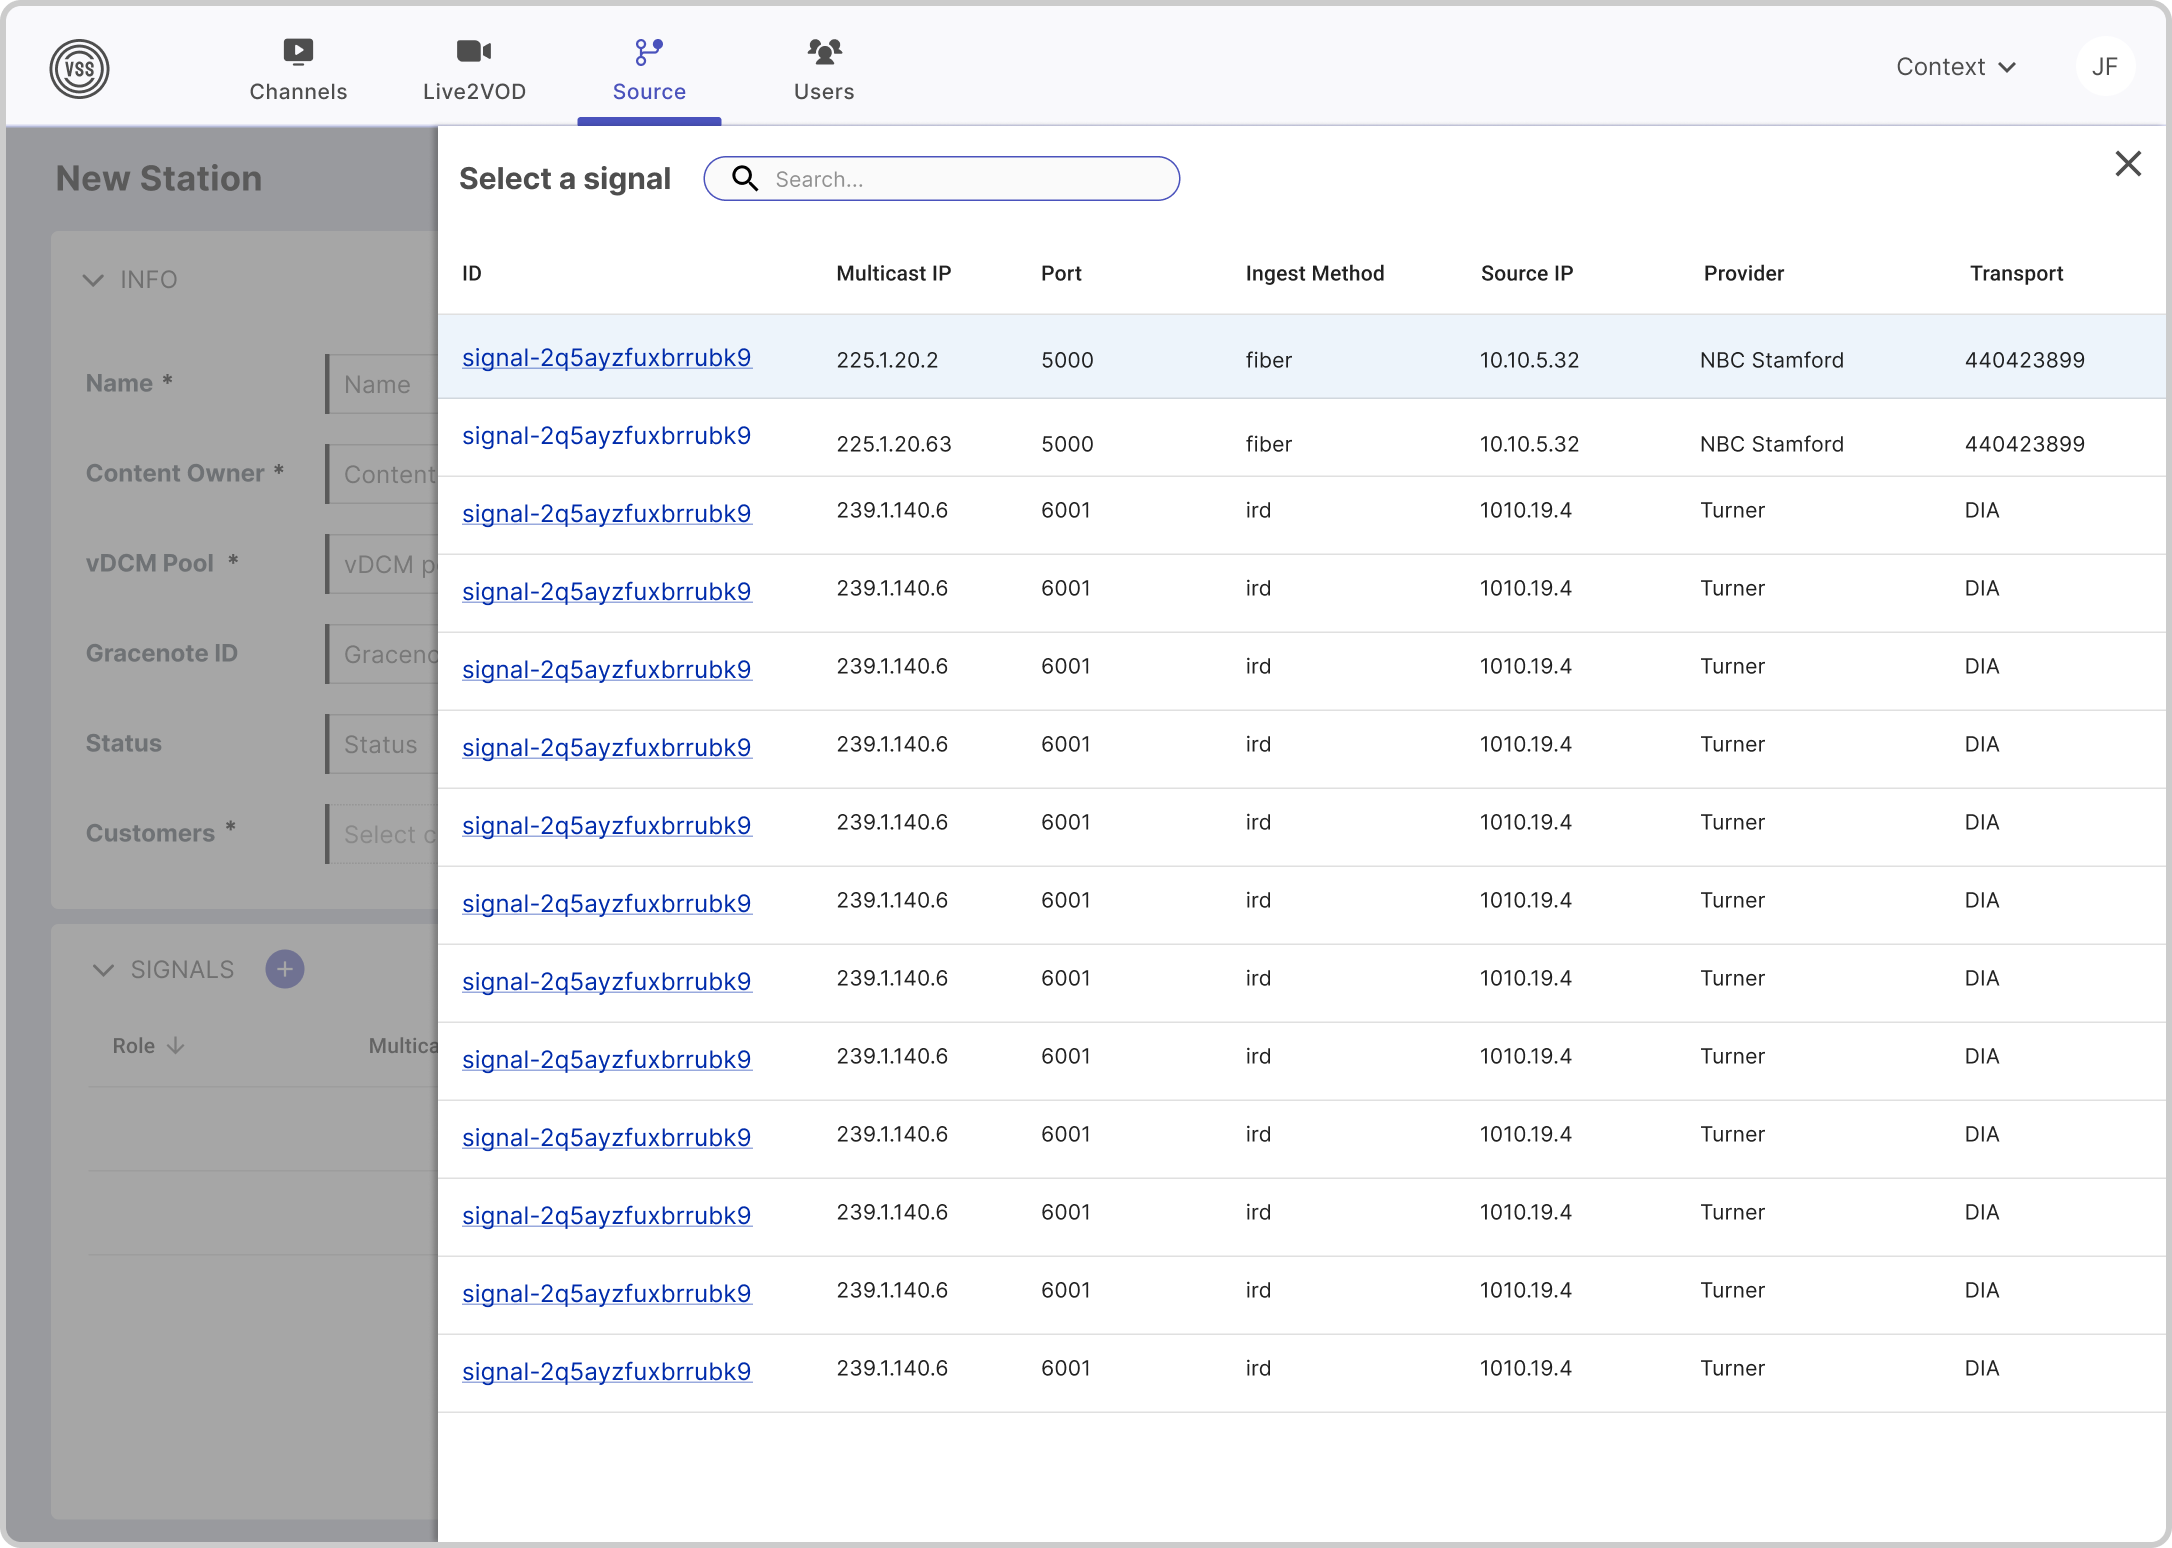
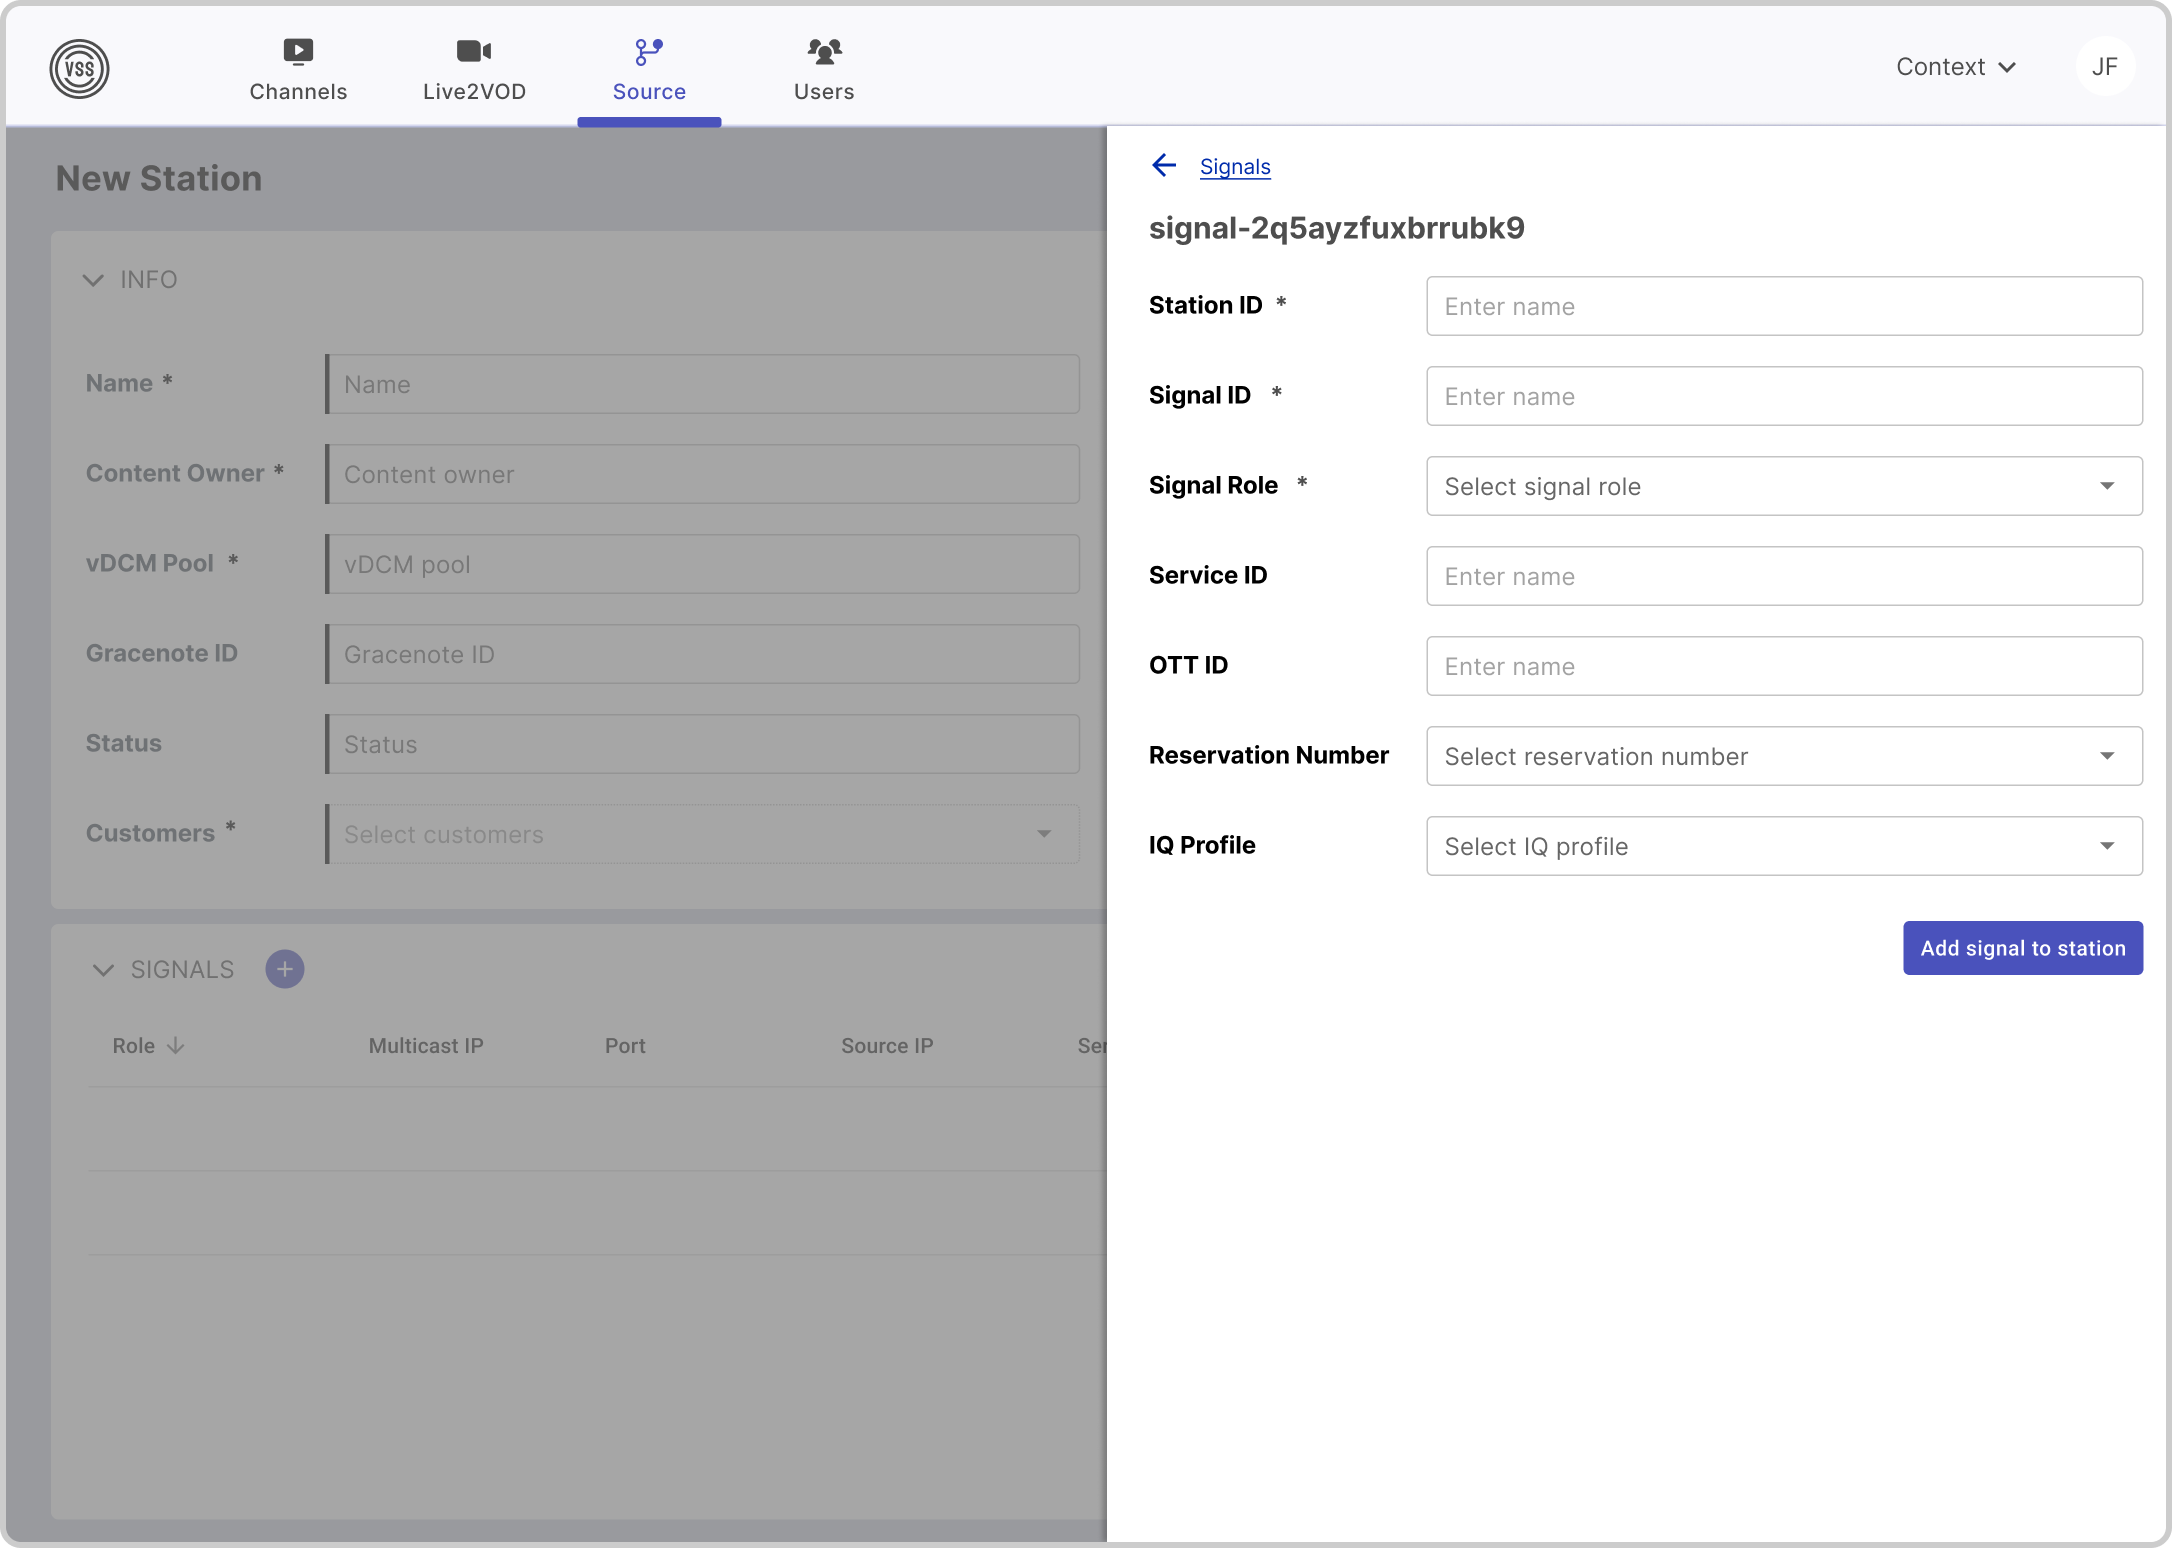
This was also the opportunity to start thinking about the system as a whole, including all the other functionalities needed to run live events. In this picture Sourcerer, renamed just source, became a part of that new system.
At the same time we were merging with Warner Media, and we called the name of our new product, VSS for Video and Streaming Services after the name of our new division.
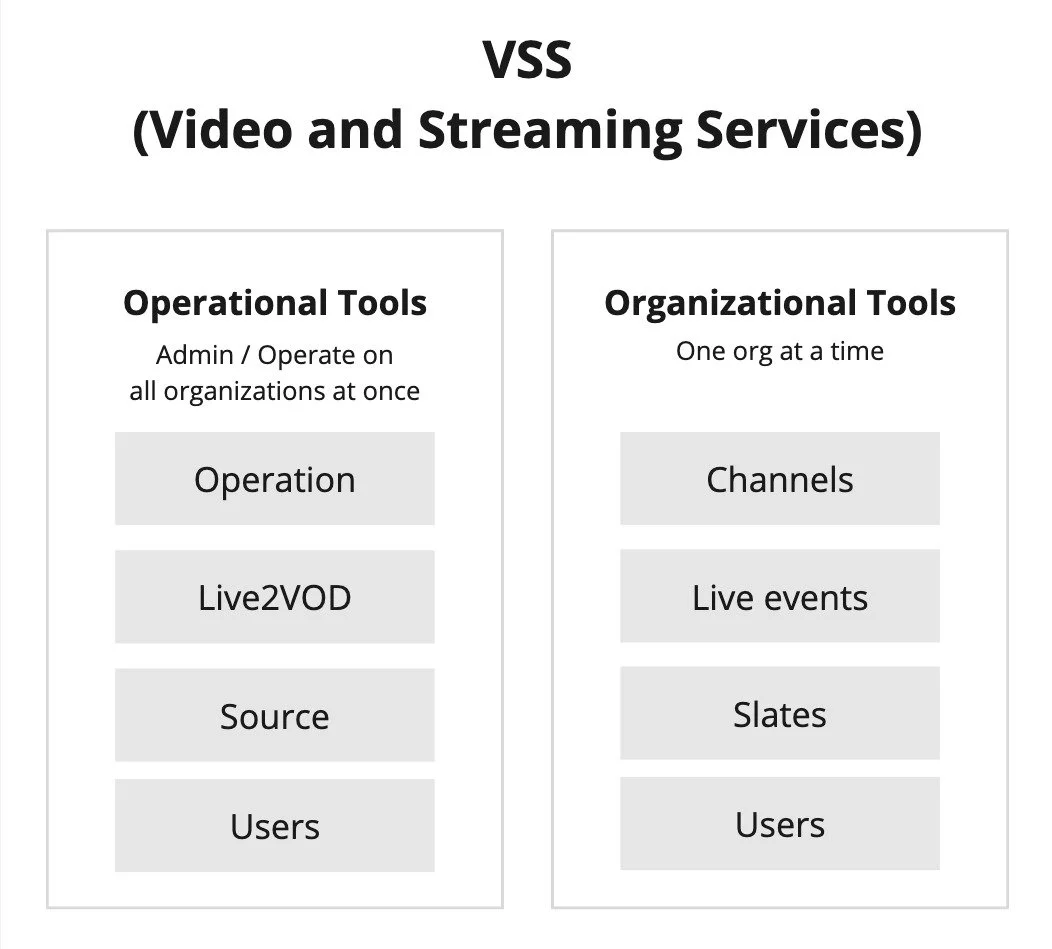
At the time it made sense for every one to merge most of the tools into one big platform. So I started working on a few different solutions for a new navigation.
The logic, coming from legacy thinking and processes, were pushing us to make a division between
→ Operational tools - mostly used by administrators and engineers, and
→ Organizations - used by operators running events in one dedicated organization, or brand (a name we would later adopt within WBD).
Here are two solutions that I proposed for the new system.
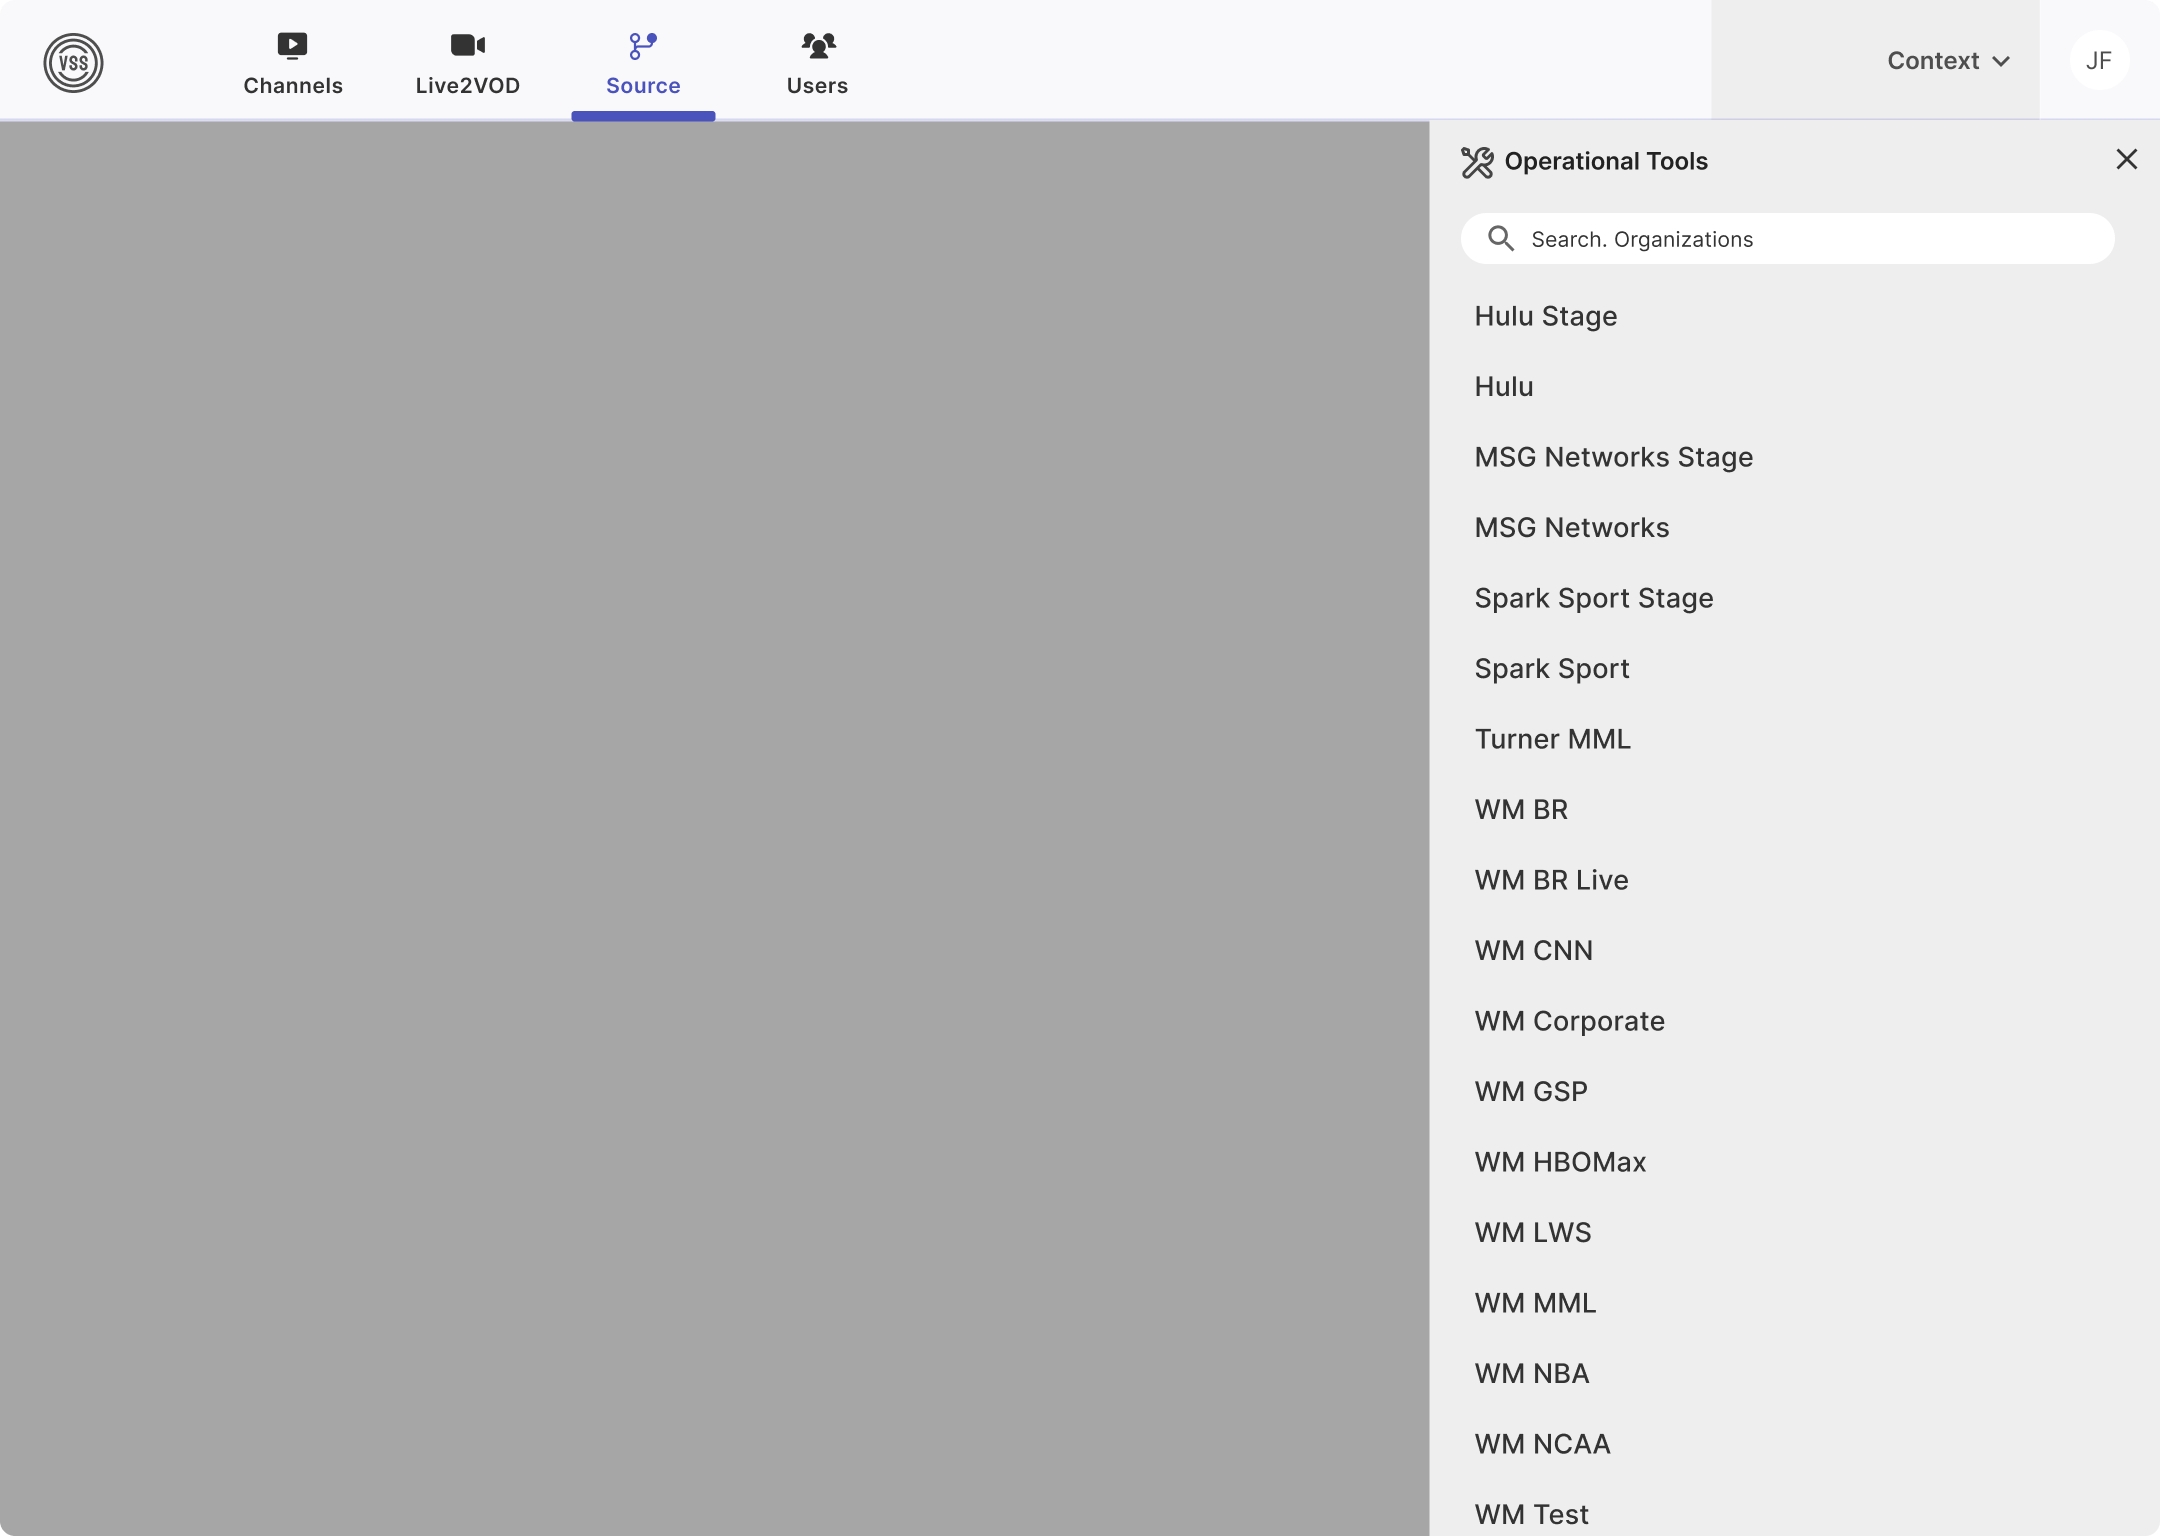
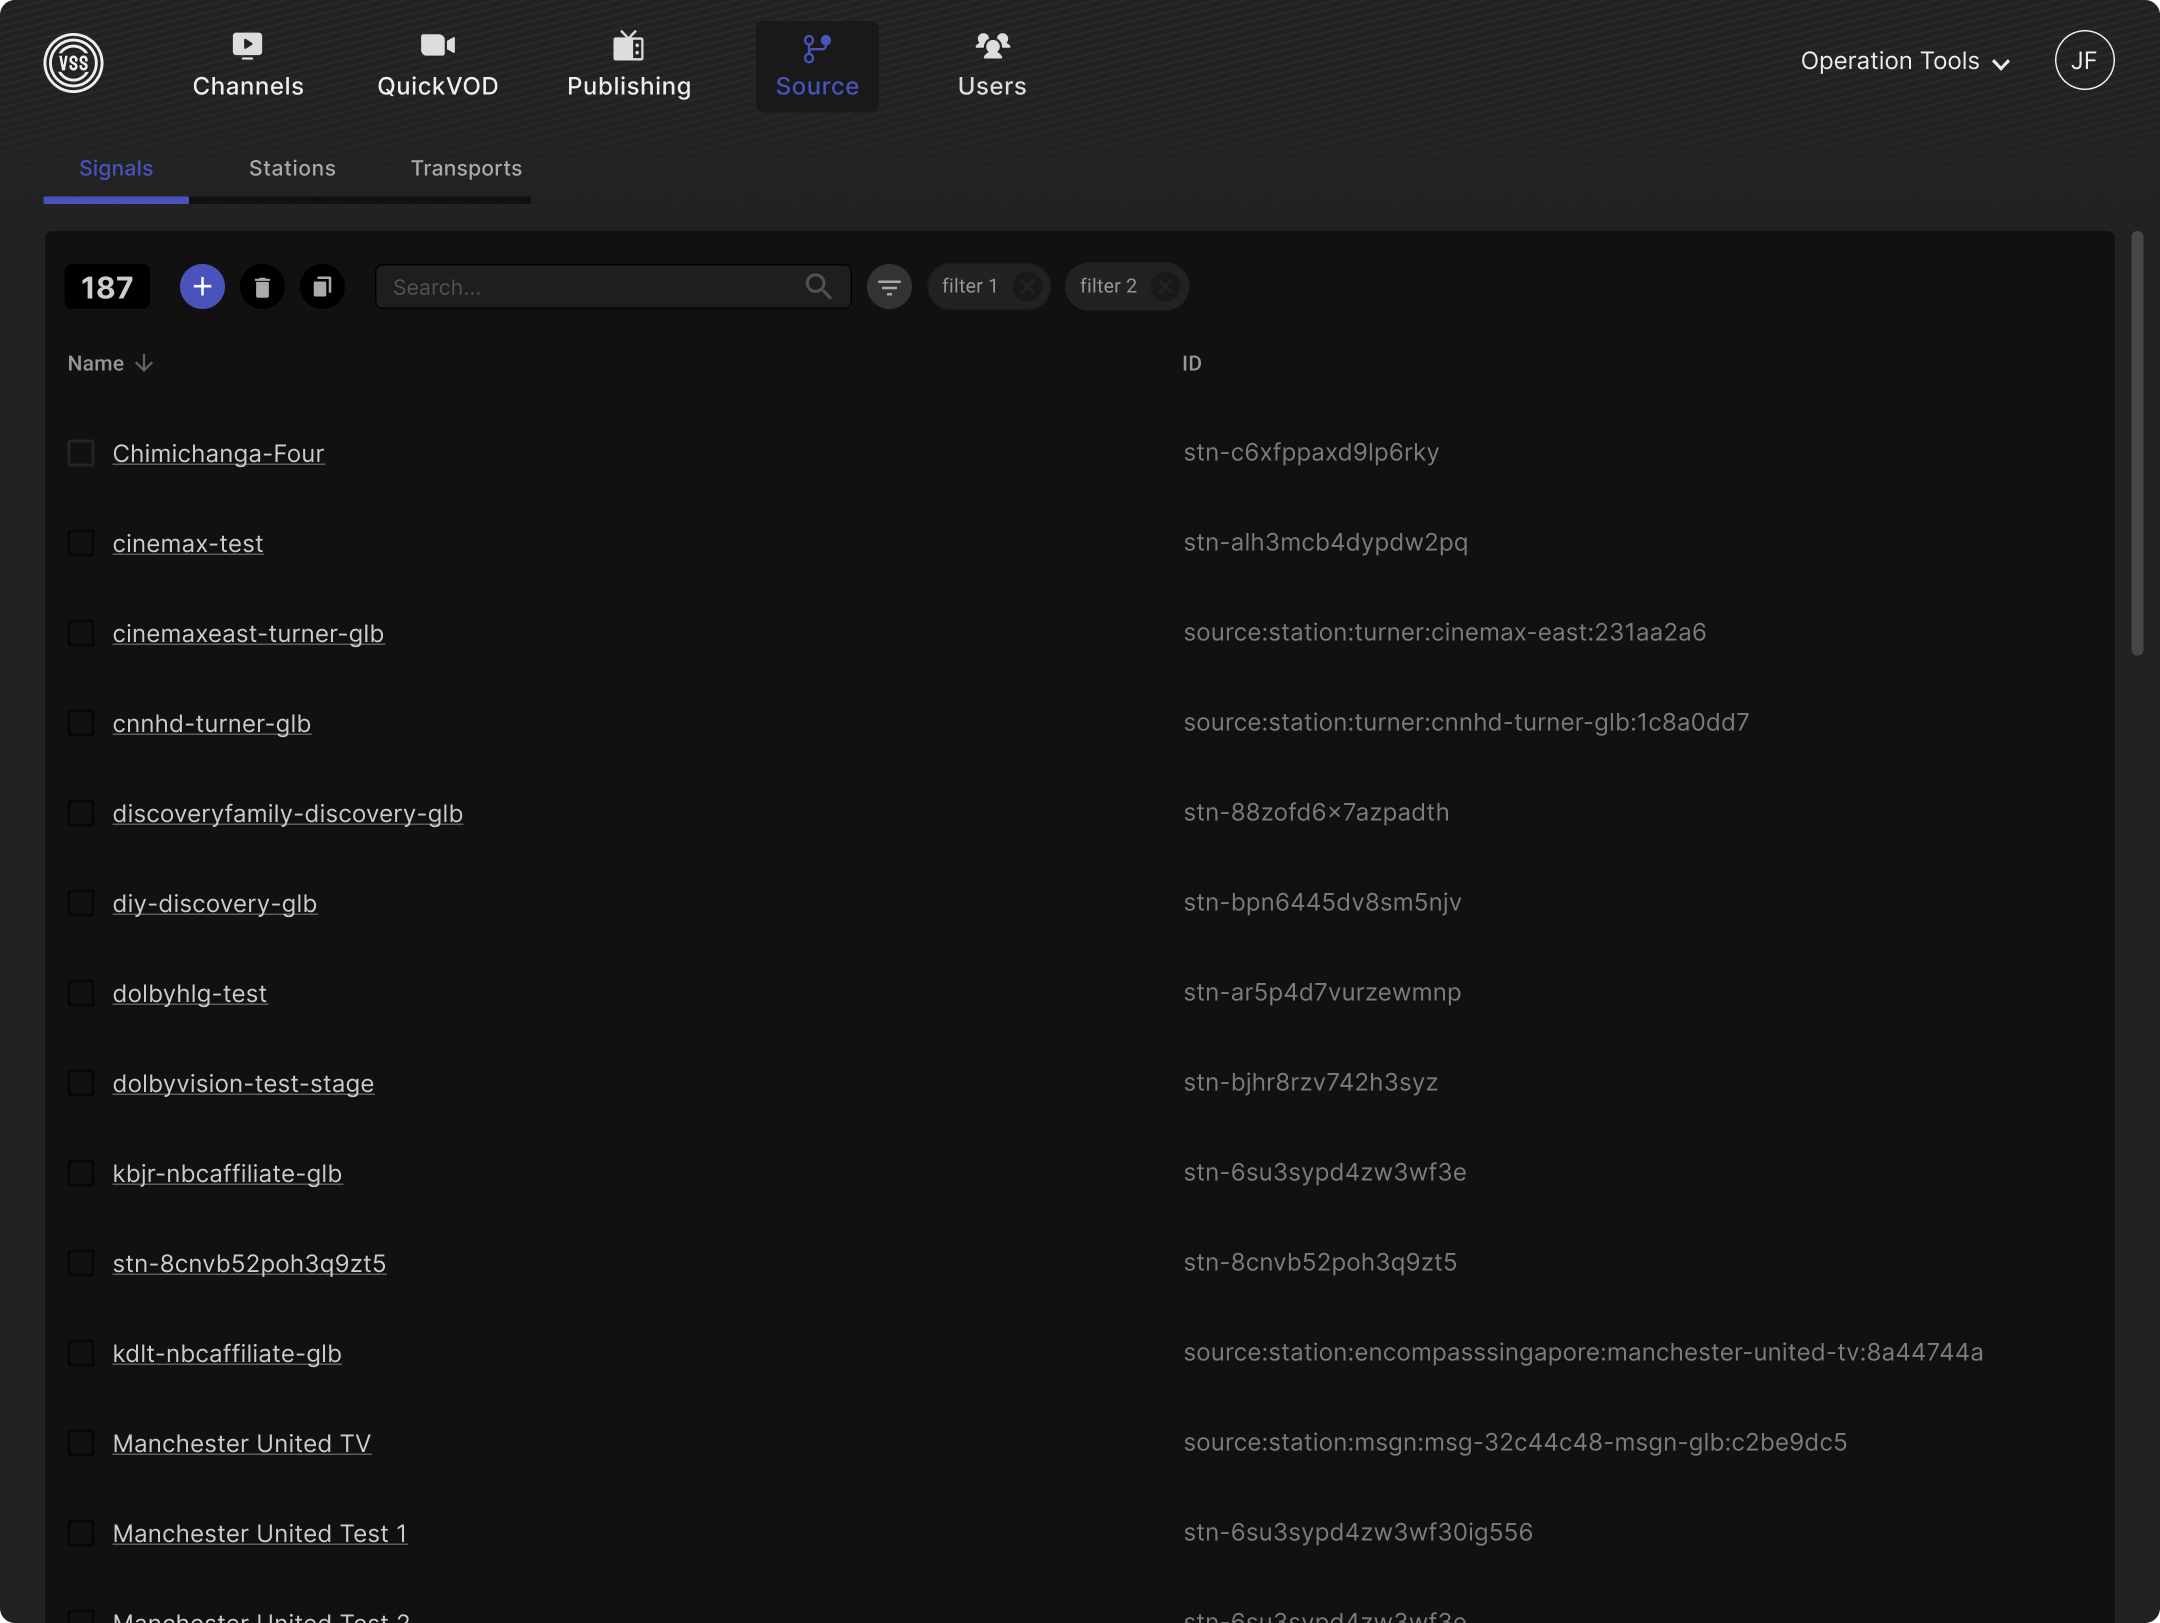
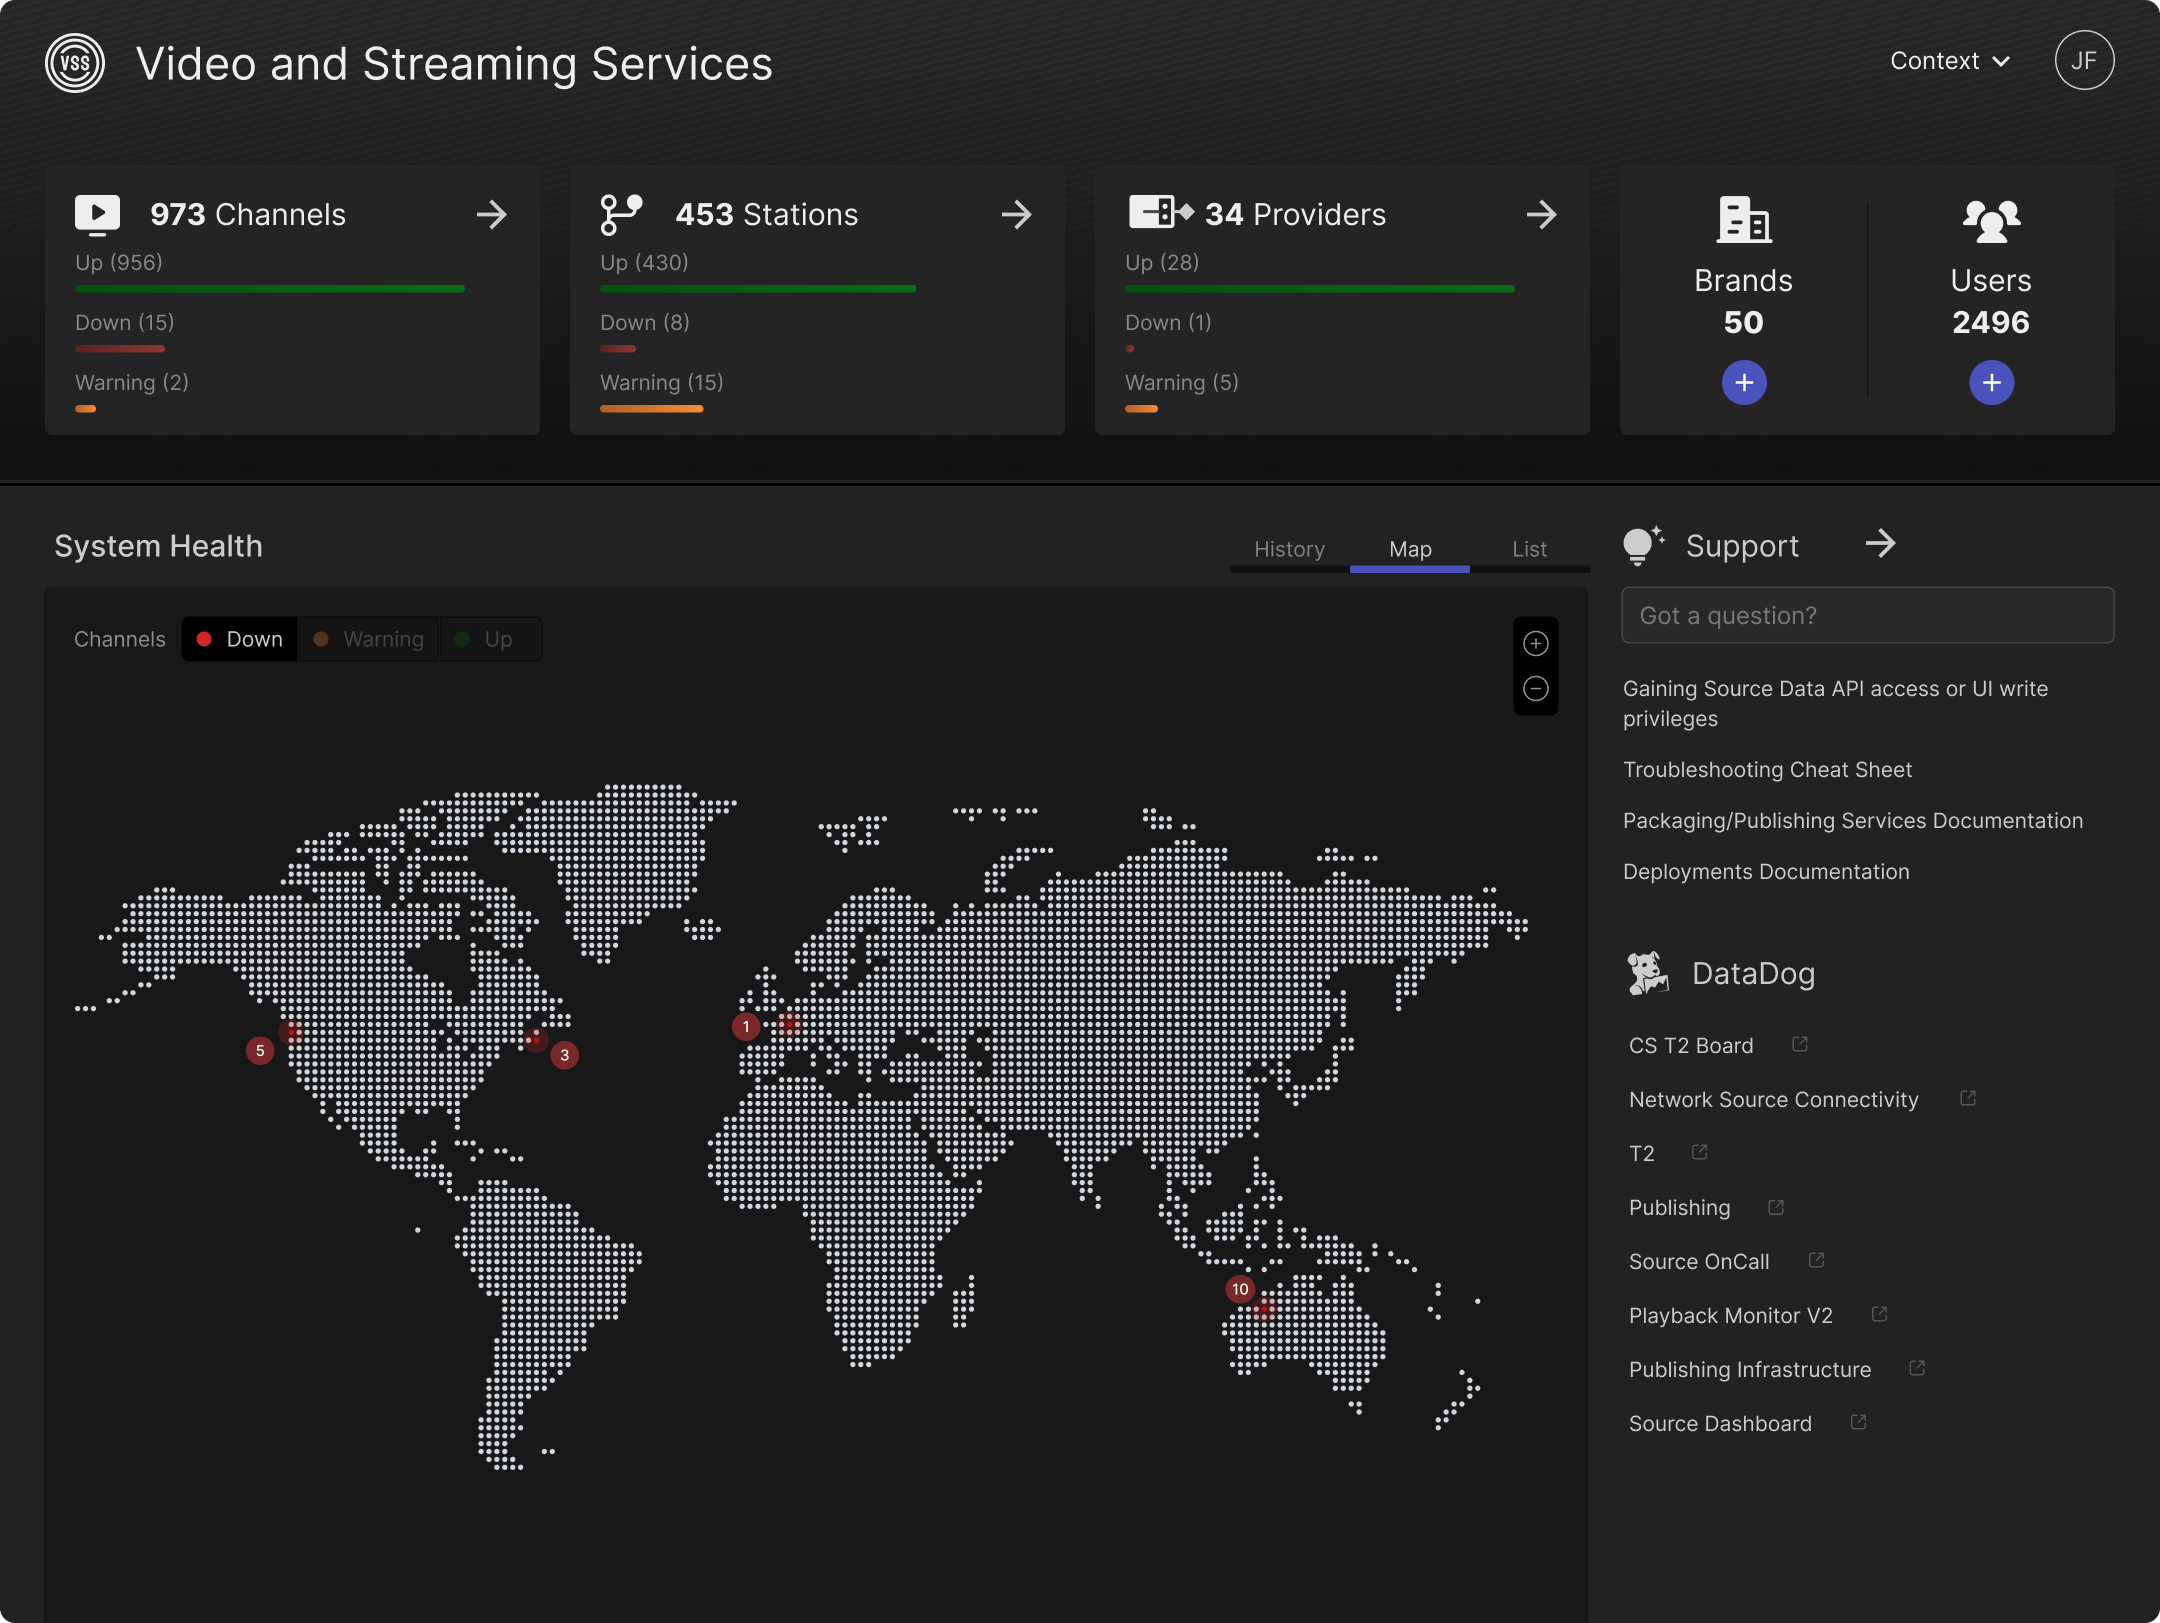
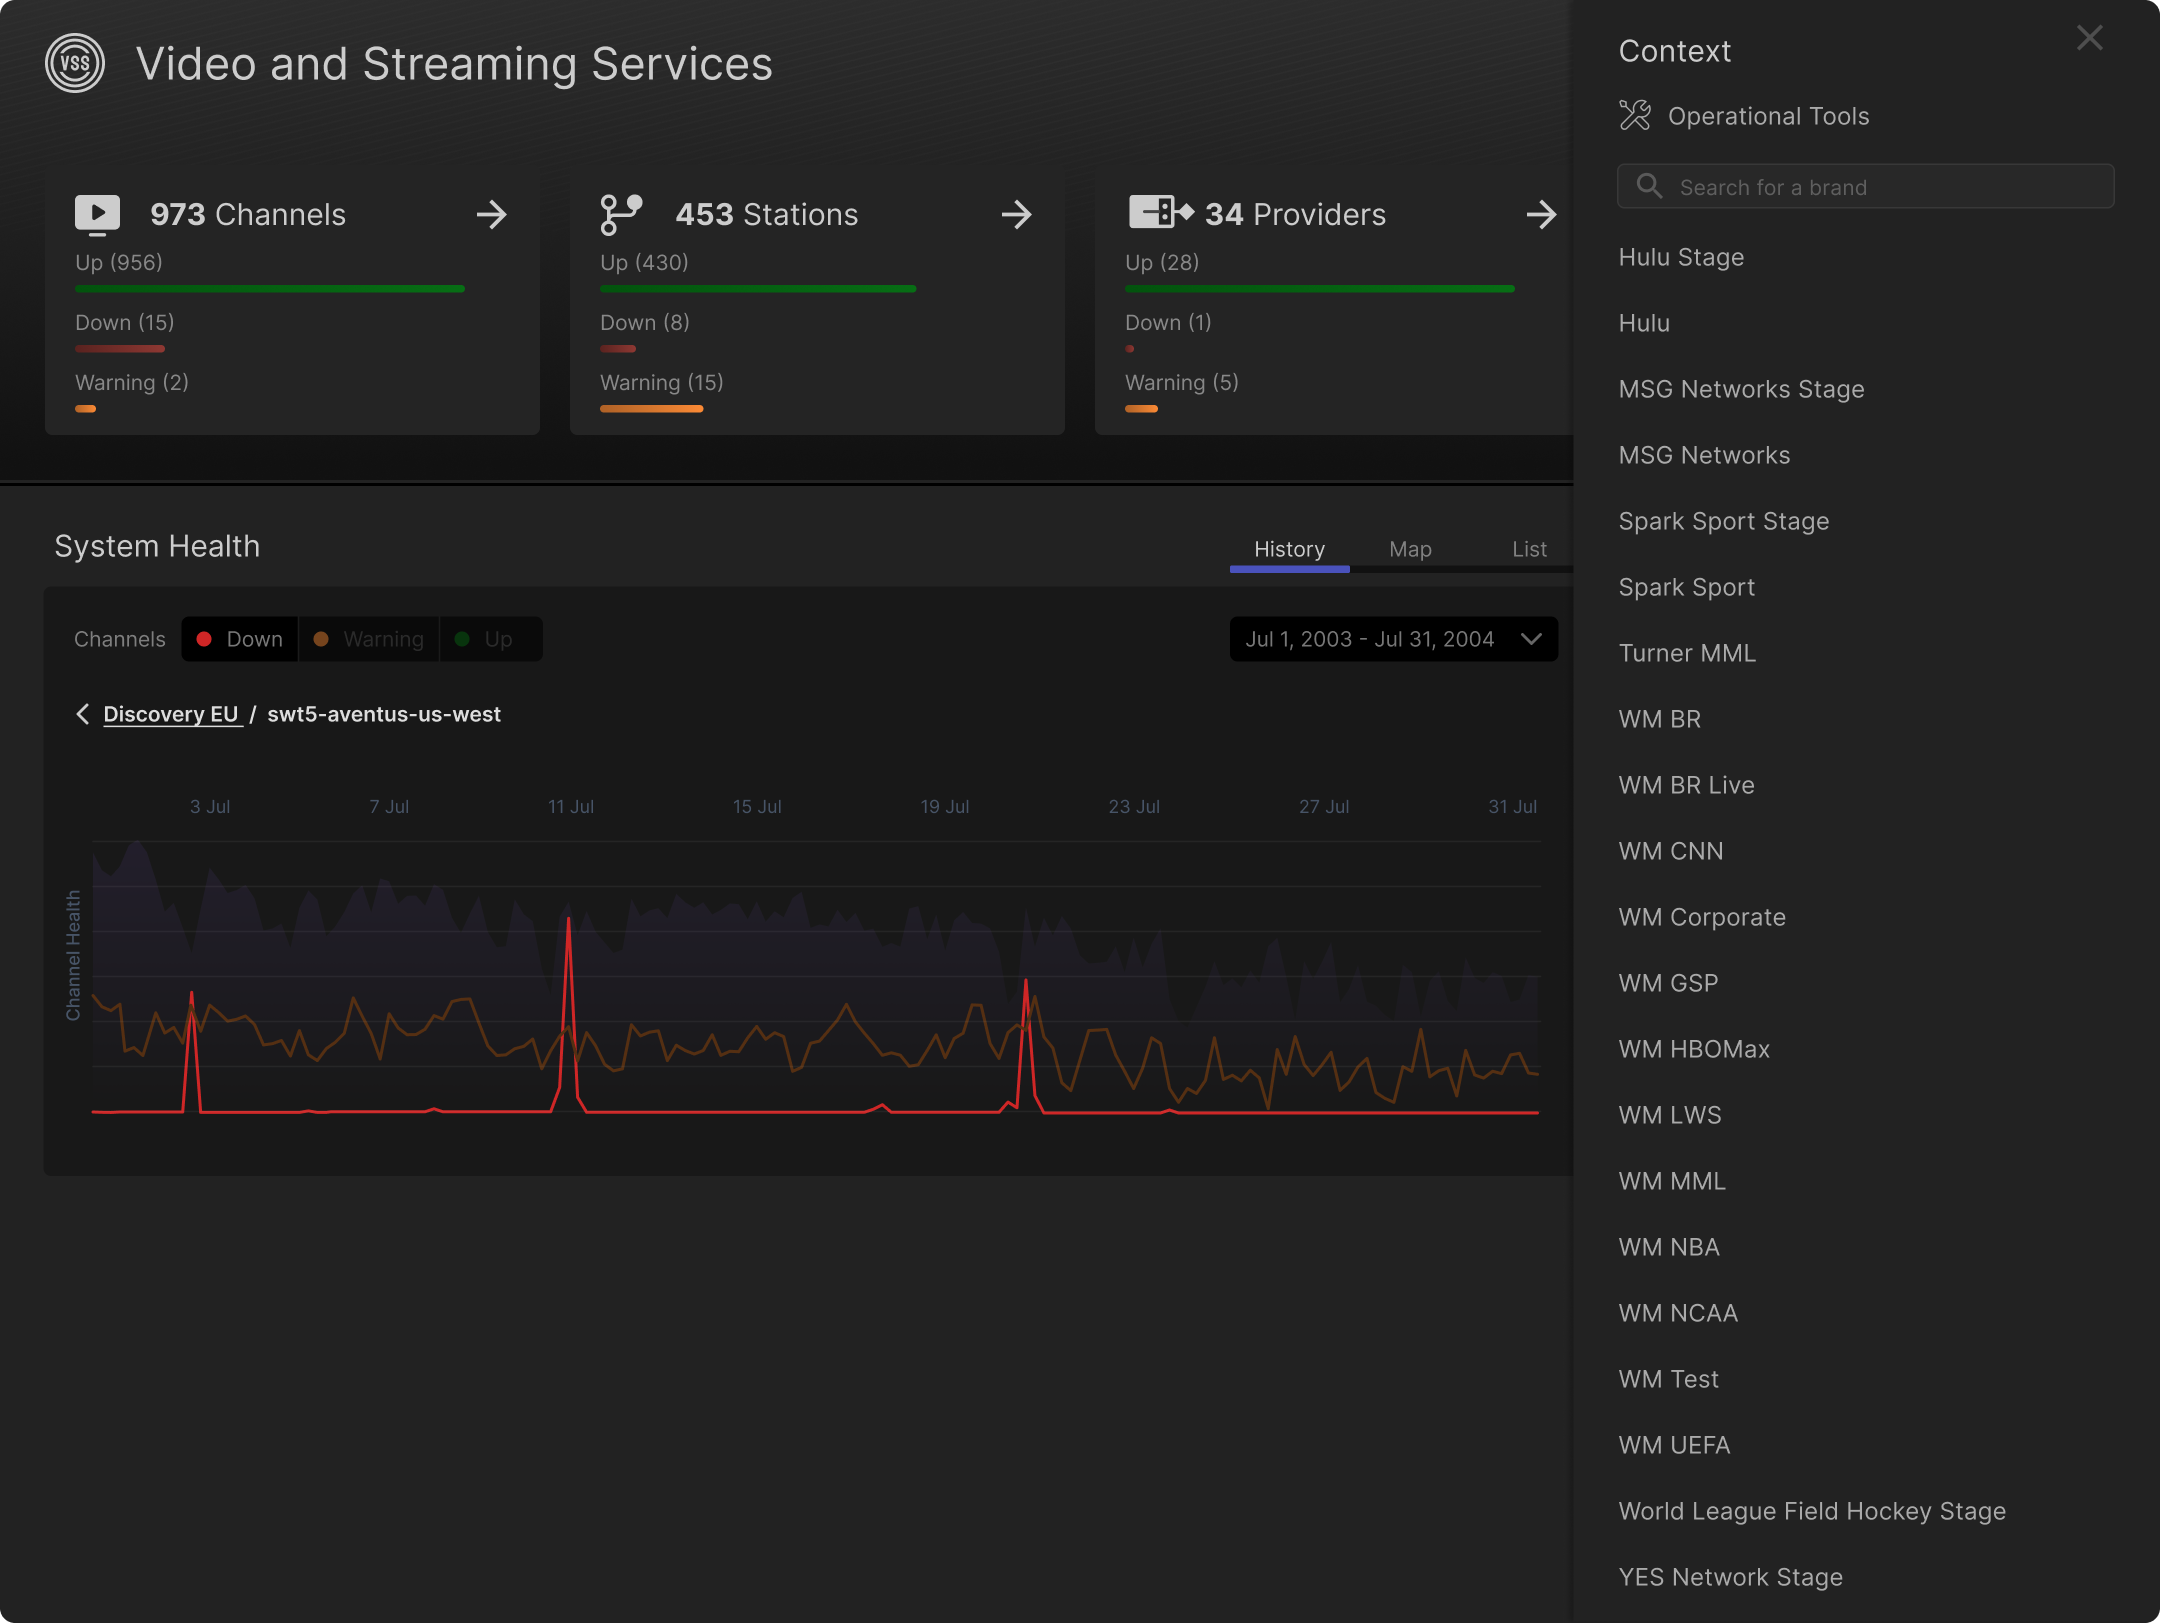
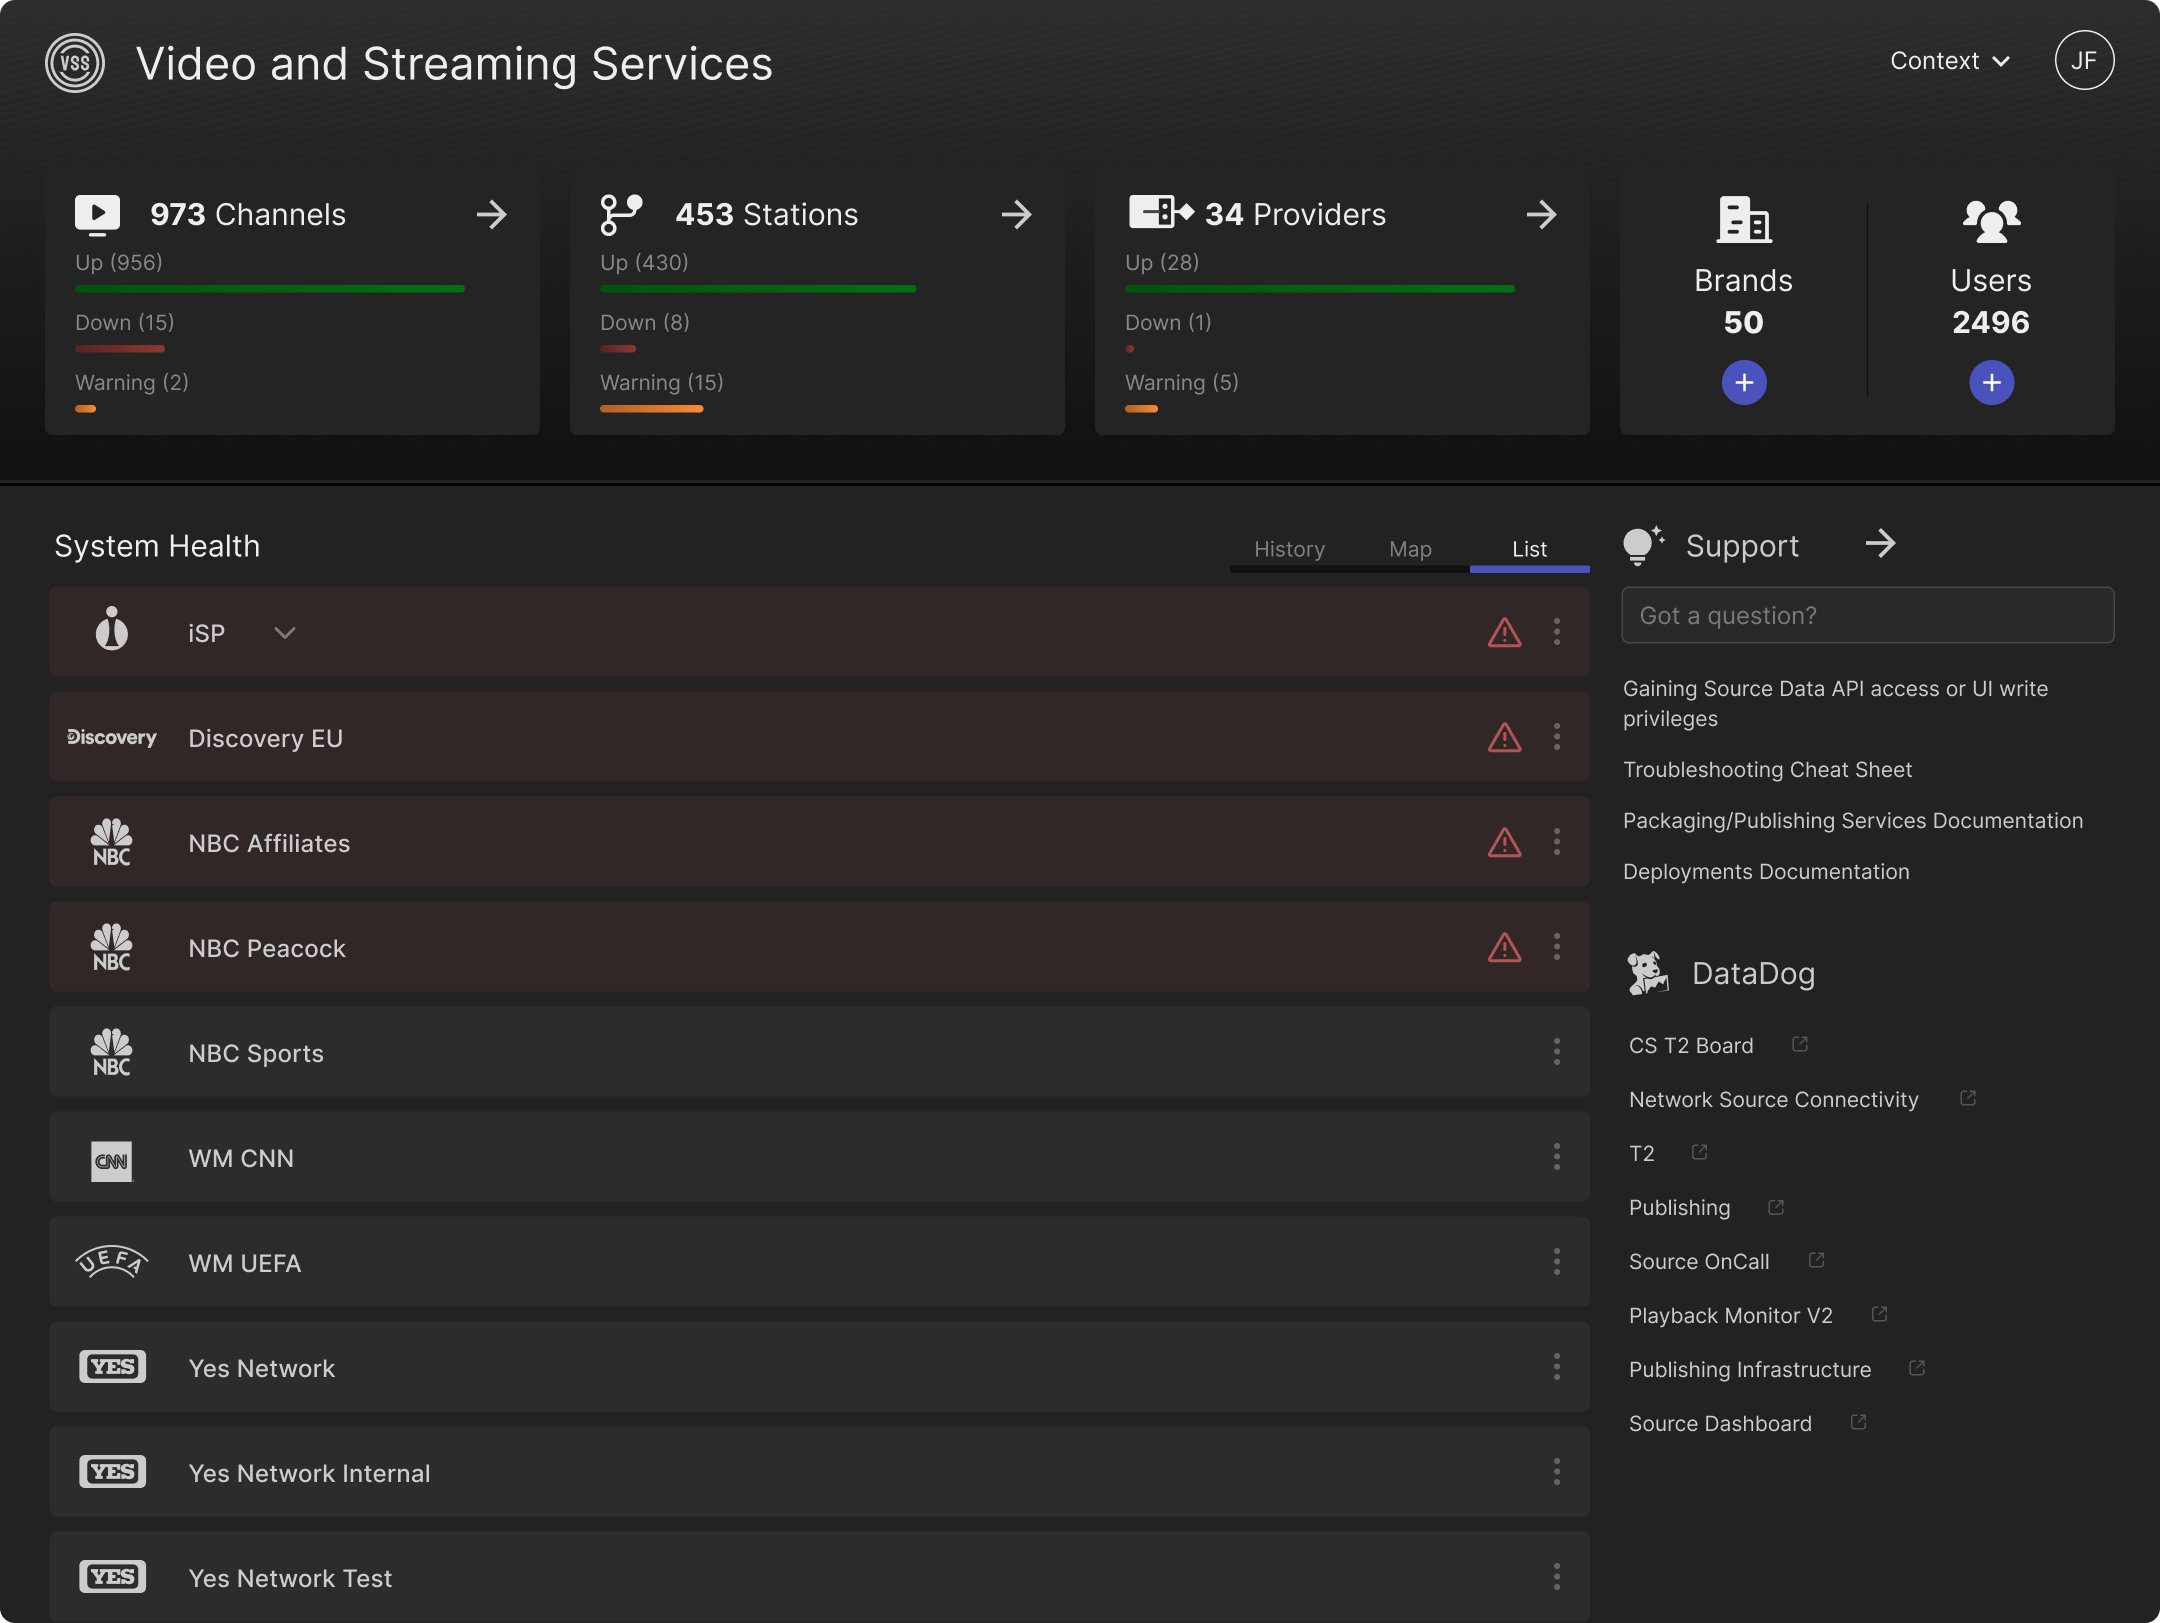
Horizontal navigation and a context menu allowing users to switch between organizations or Ops Tools.
PROS
Menu items are clearly identifiable because they are composed of a label and an icon.
Context / Brands and VSS logo don’t conflict. .
CONS
Harder to tell the relationship between the context and the tools available.
Ops tools are together, even though they don’t directly relate.
More conservative approach.
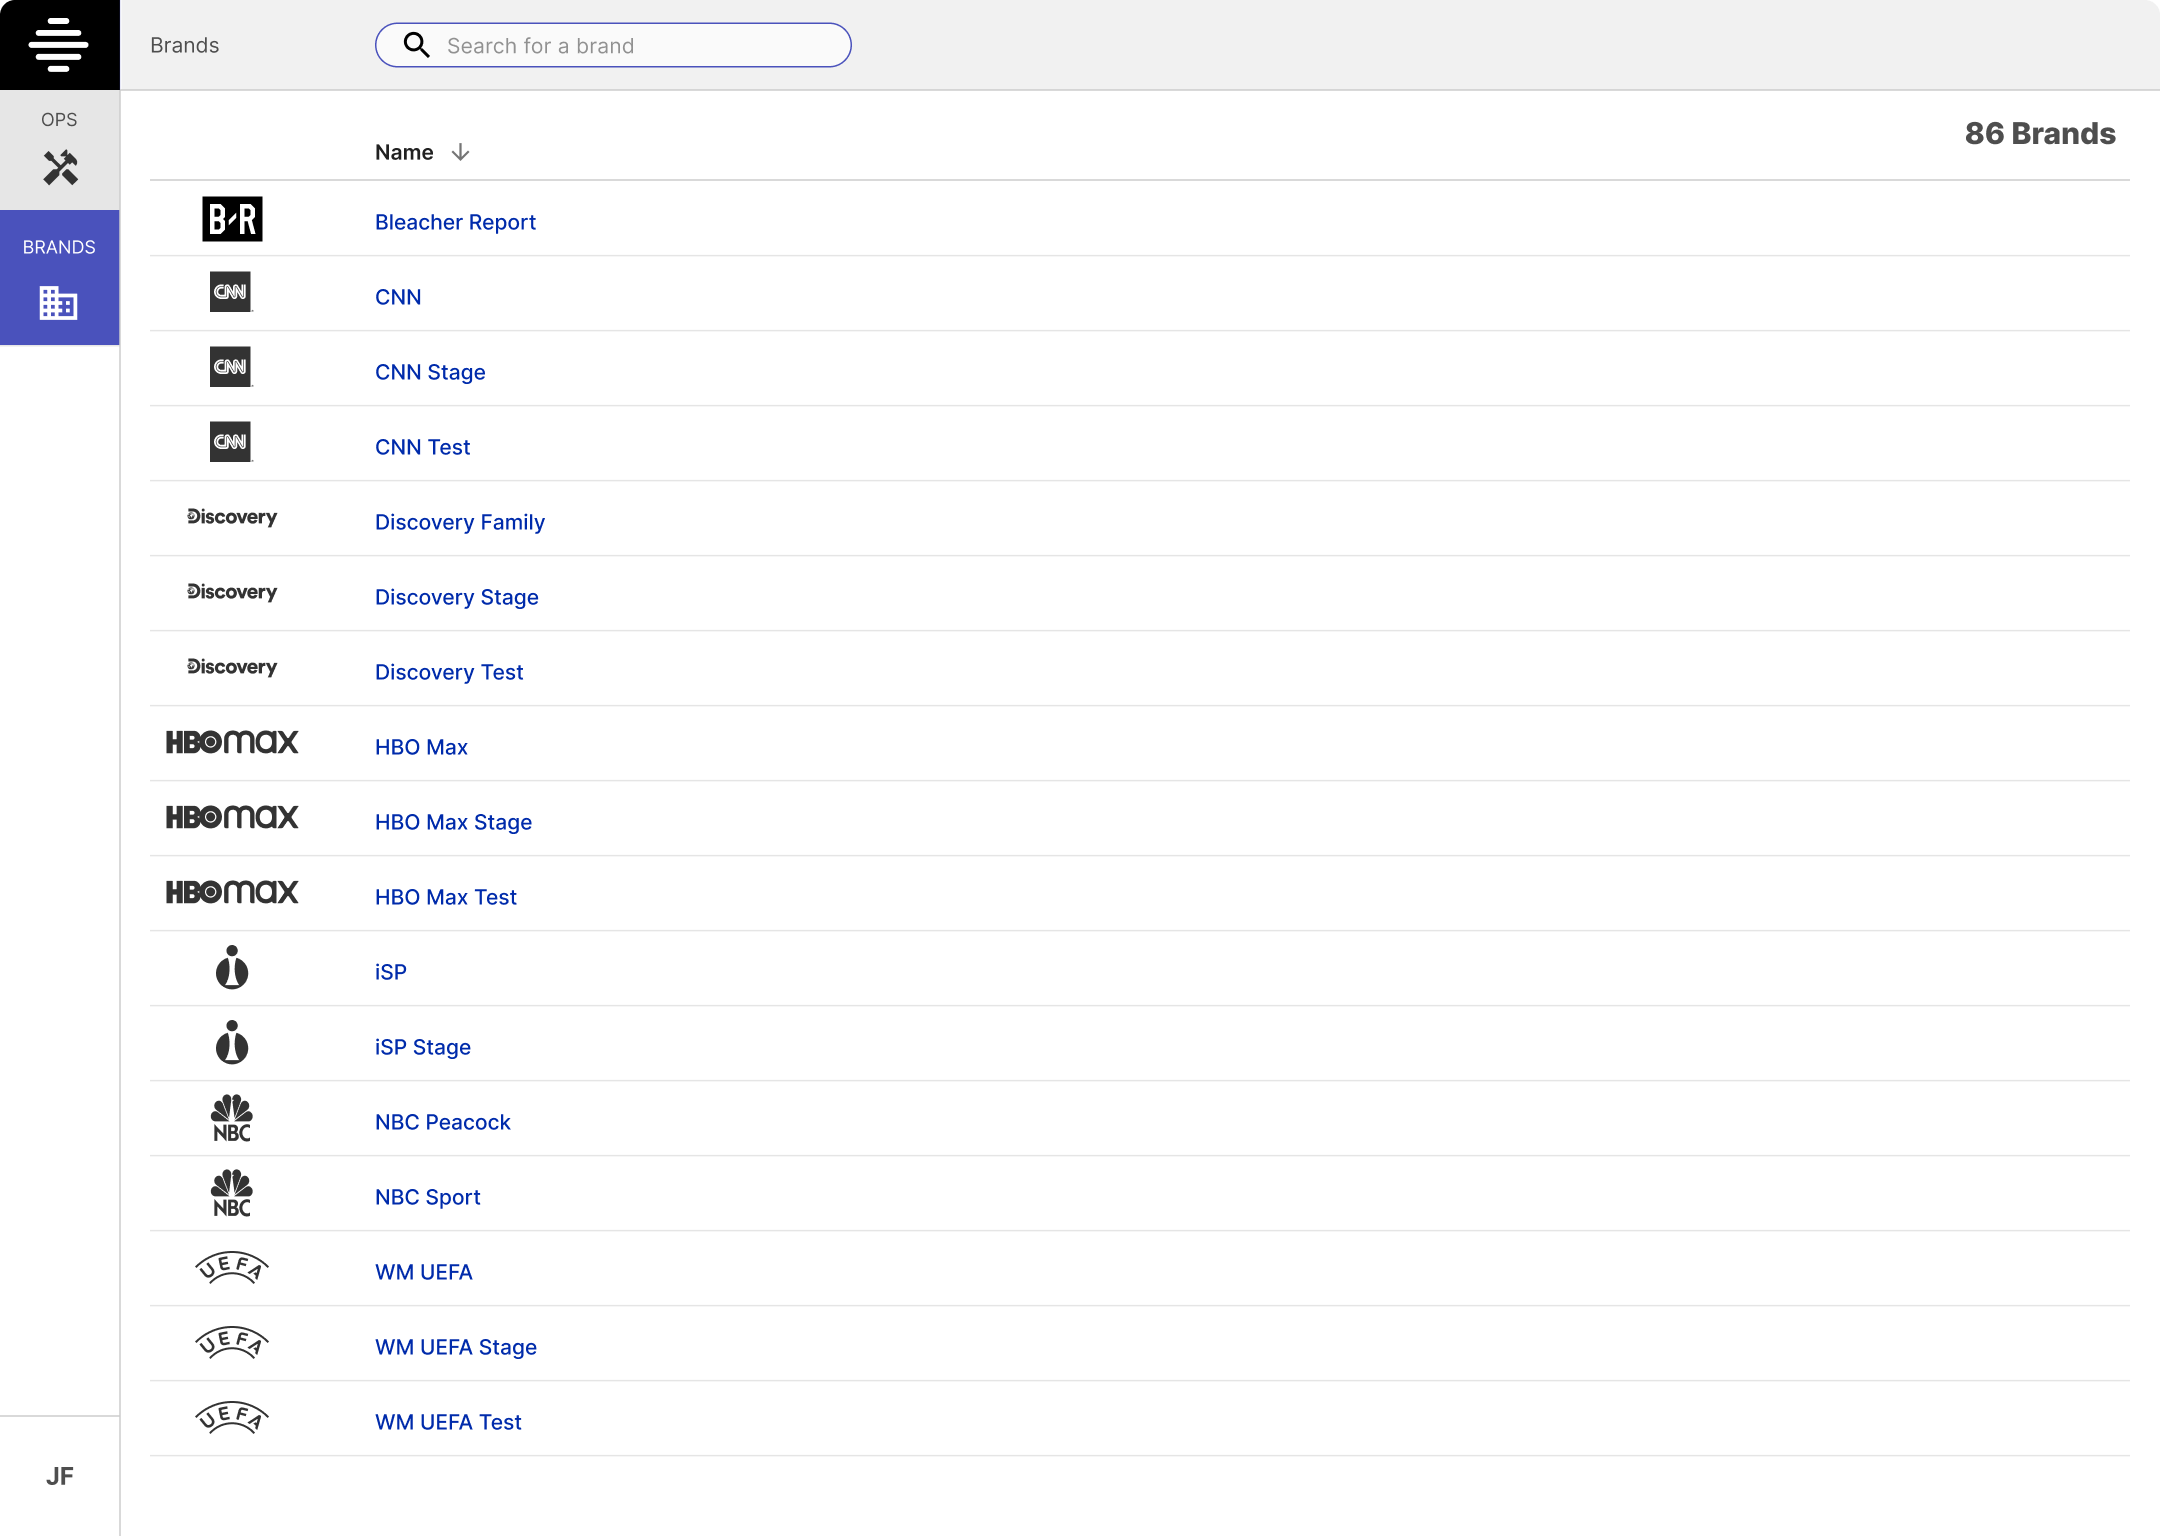
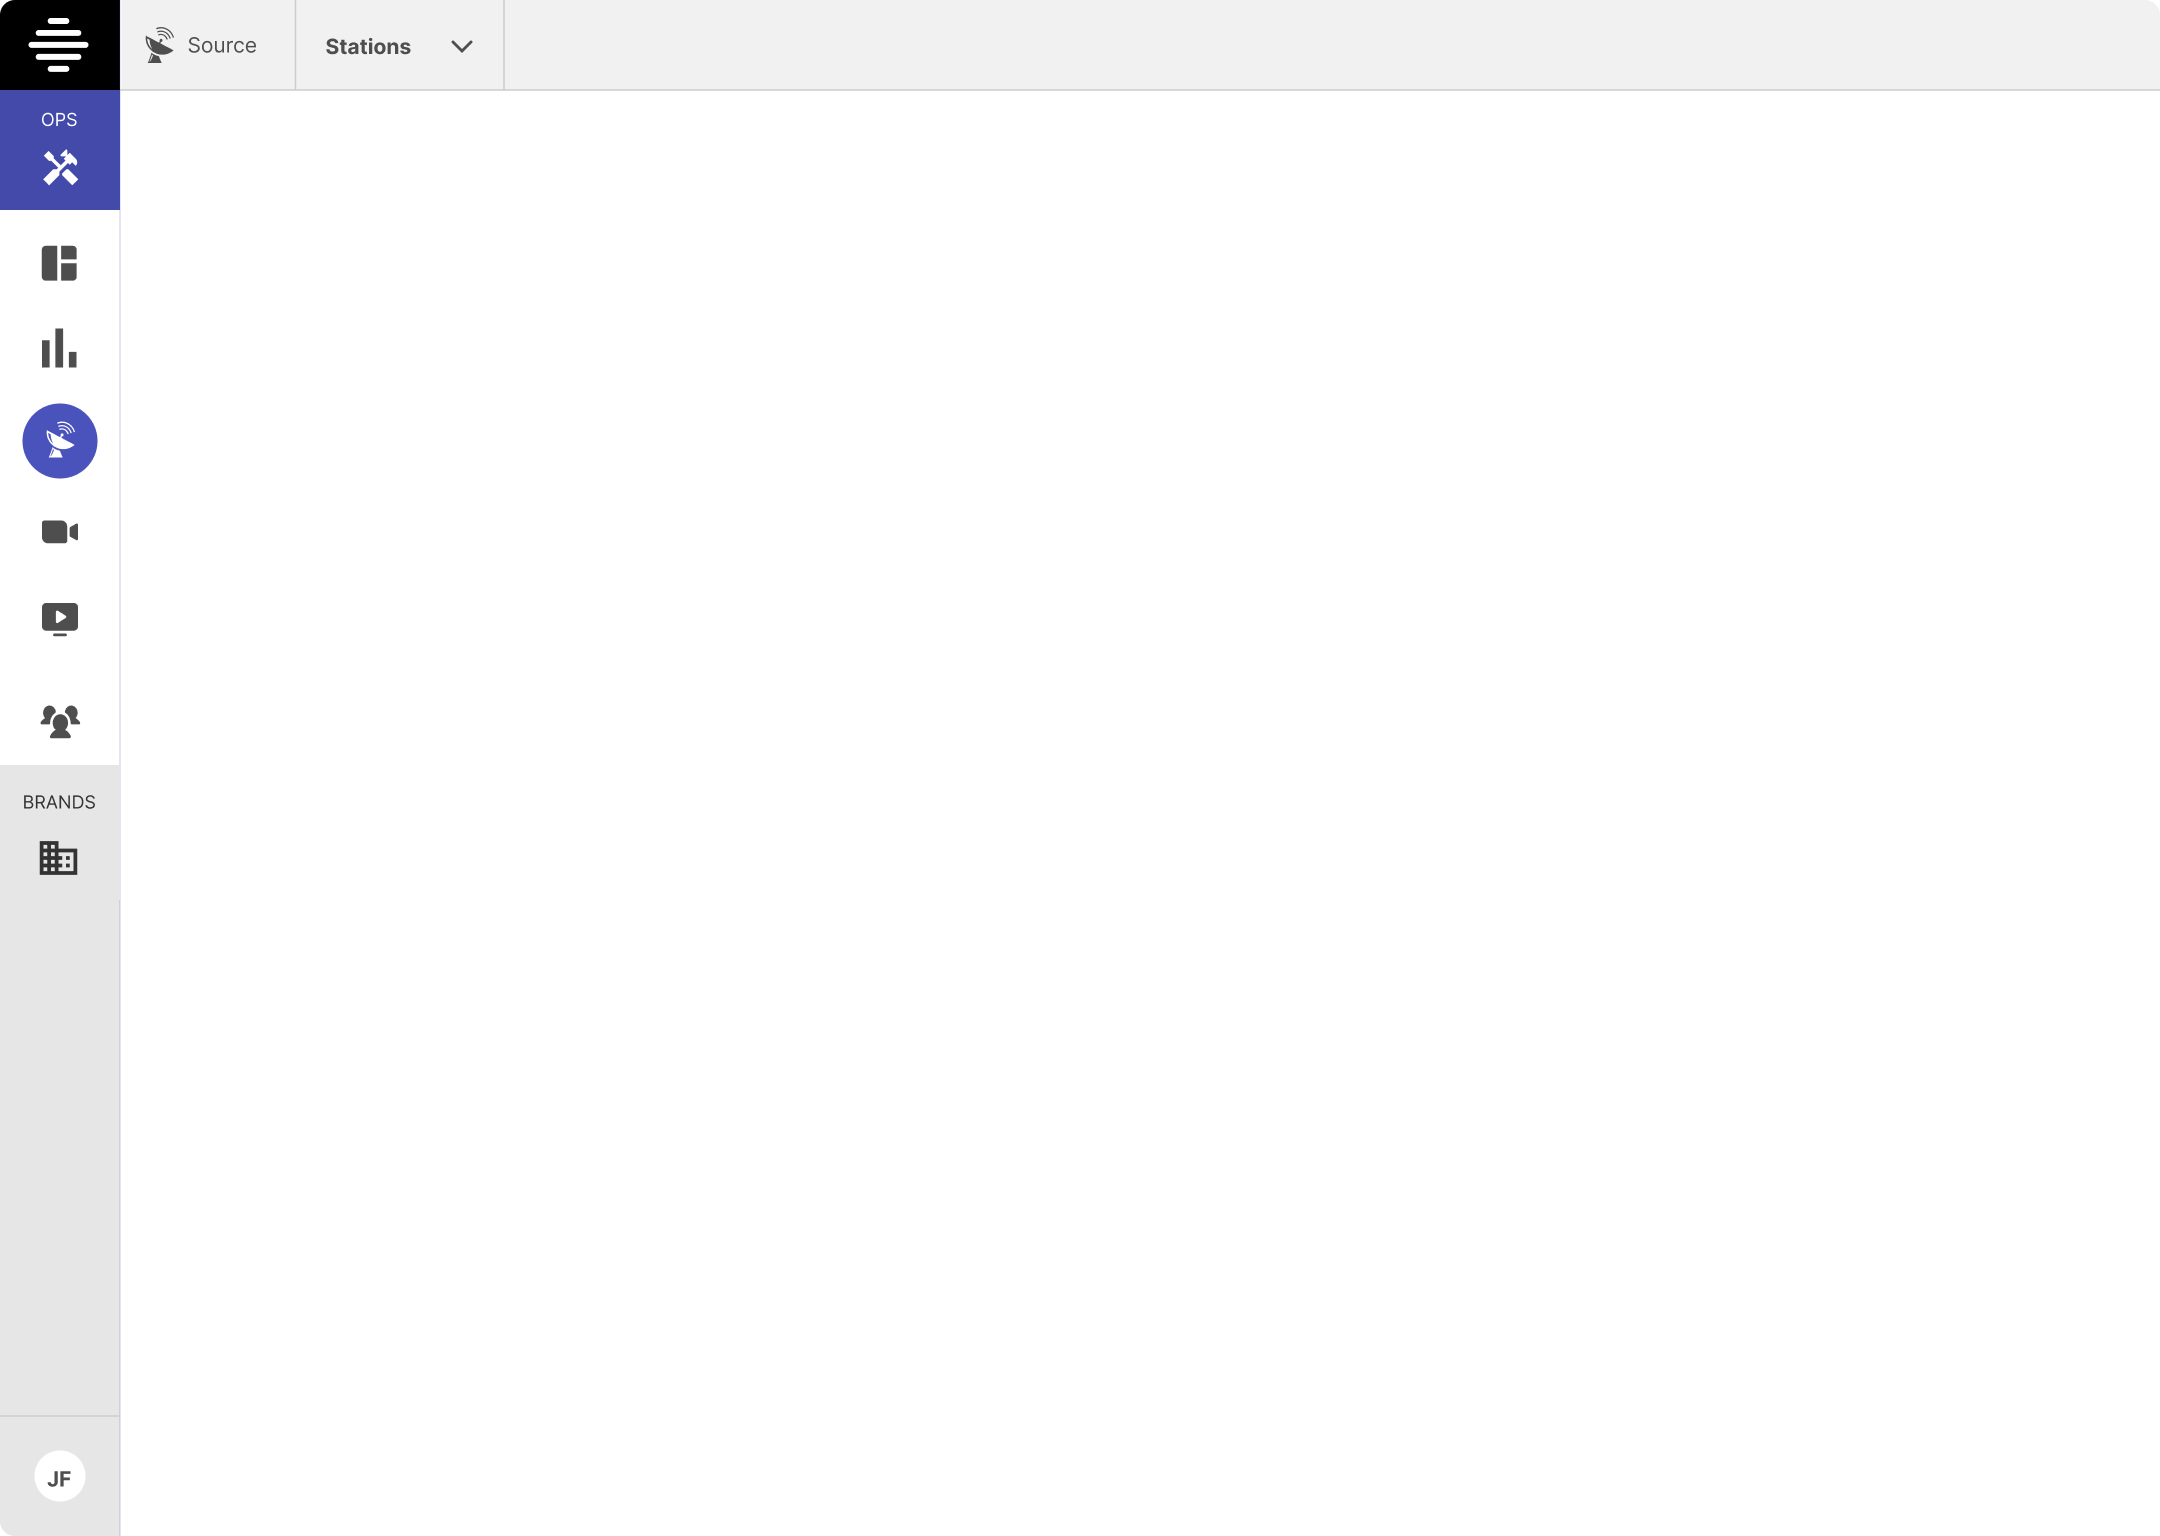
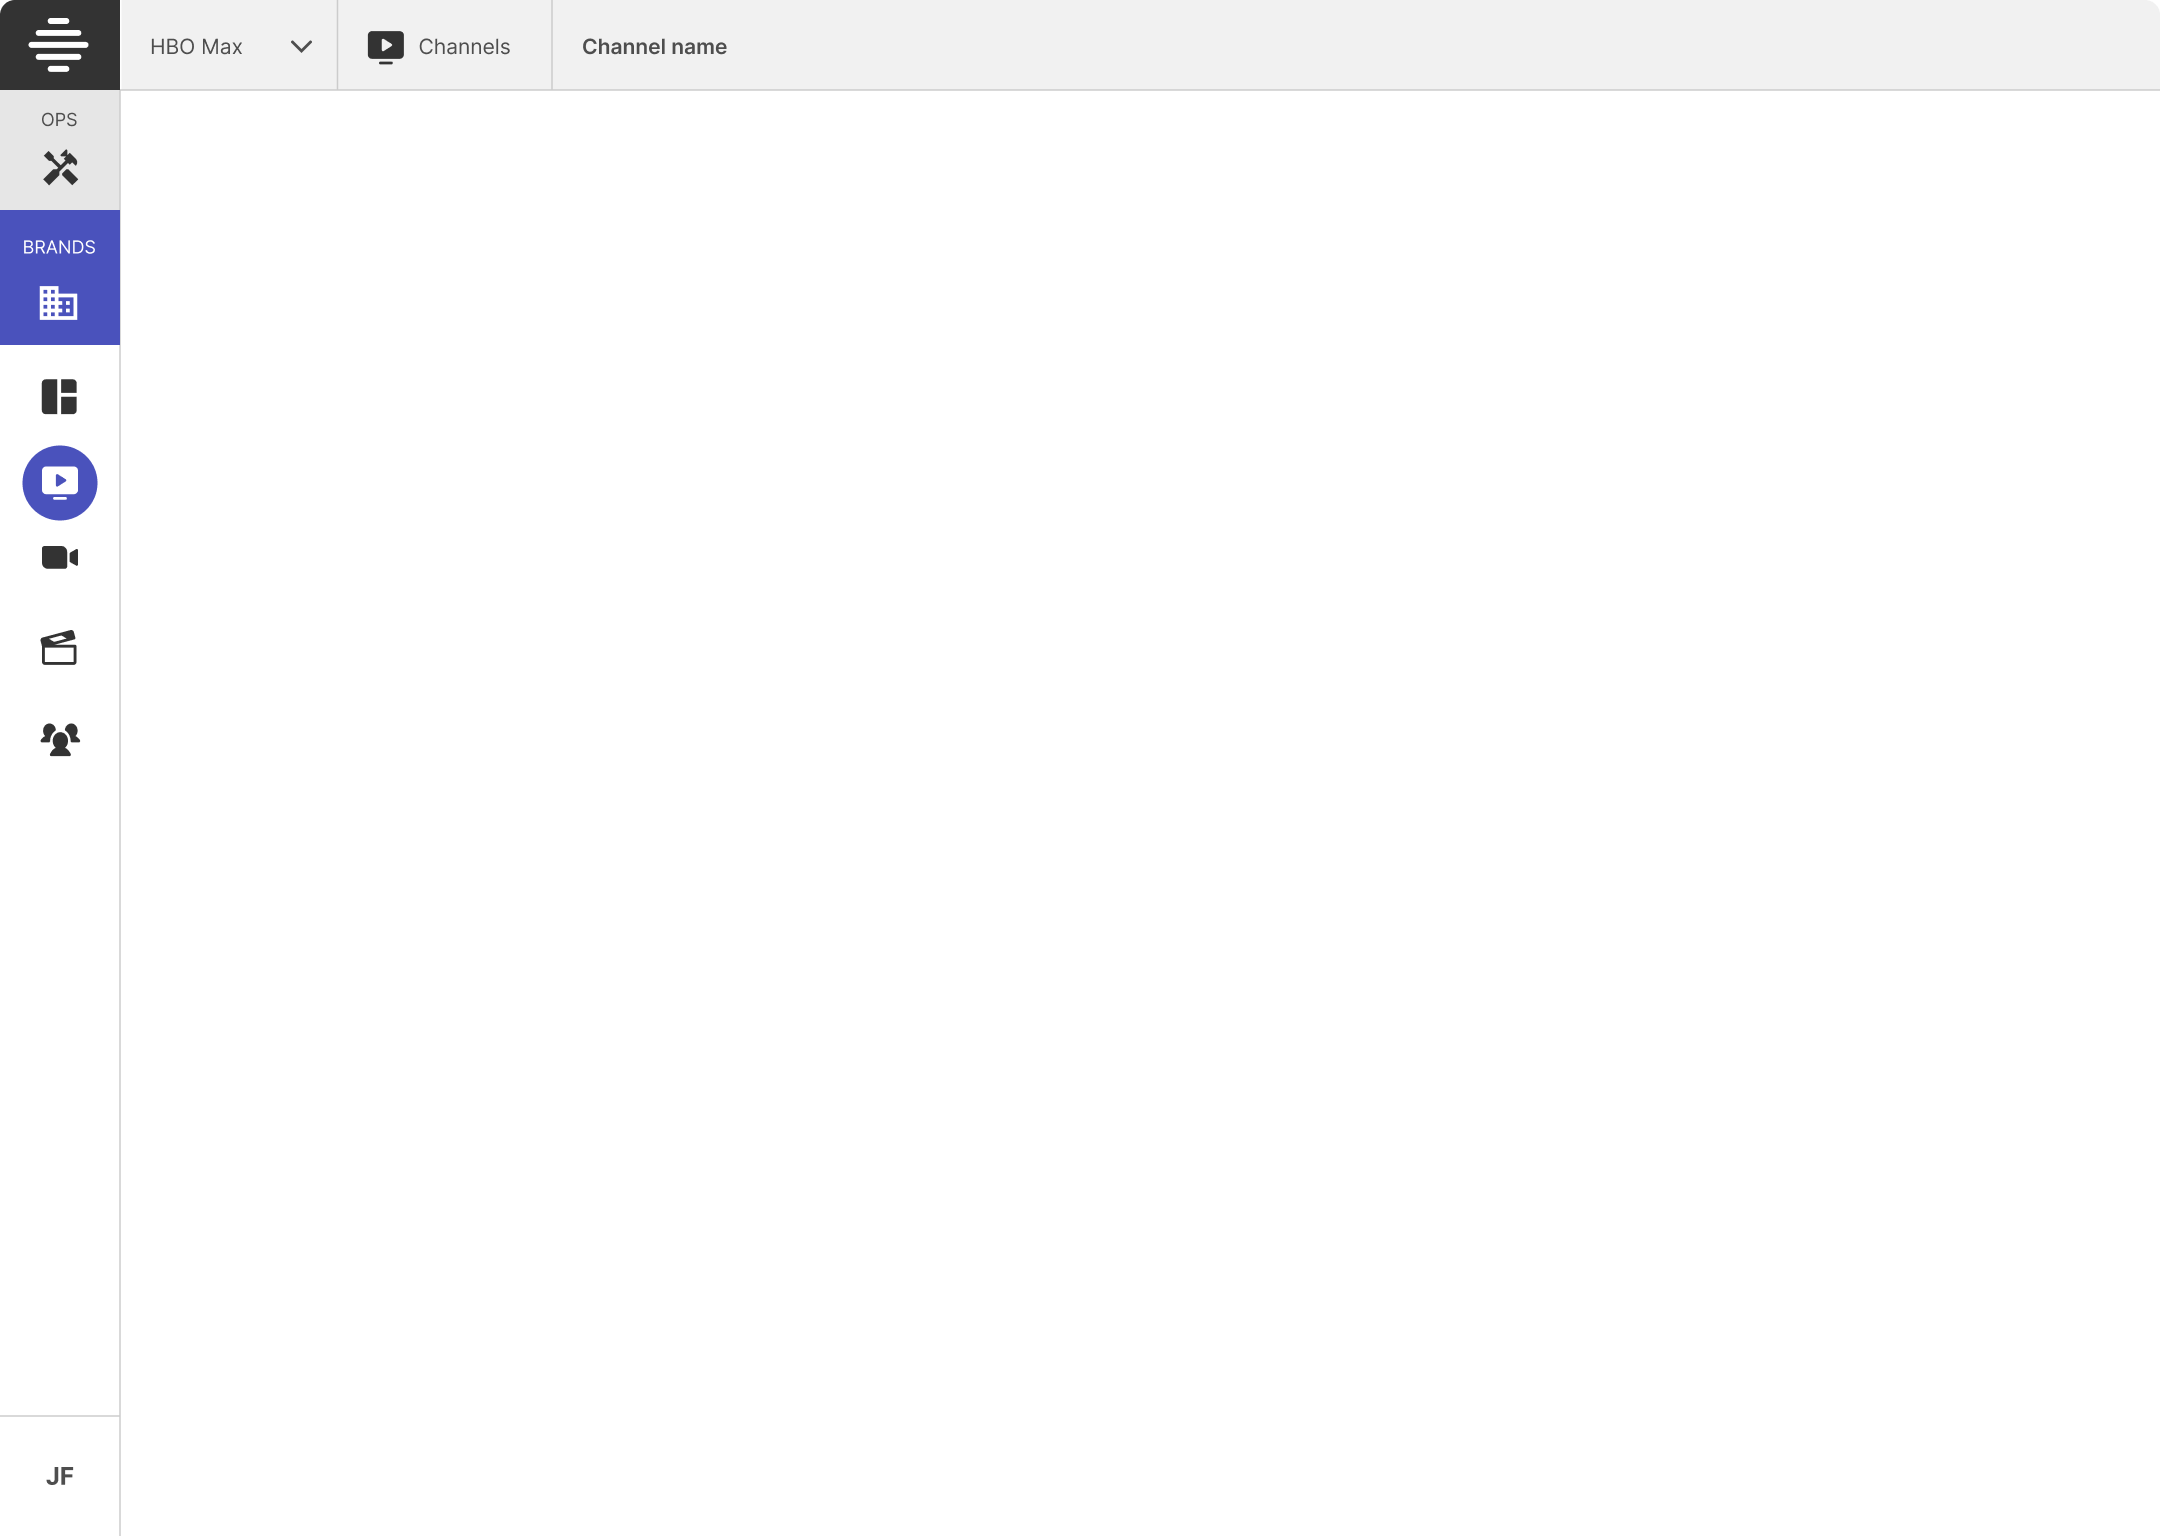
A left vertical navigation displays the tools or the brand, and their associated tools.
PROS
Higher focus on where you are
Ops tools and Brands are closer clearly separated.
More compact and modern navigation
CONS
Maybe less intuitive because of the complex interaction (toggle between Ops tools and Brands)
Too much going on between left nav, and dynamic breadcrumbs on the header.
Tools don’t have labels (tooltips only)
Dark mode
In the end Solution 1 remained the winner, and I worked on highly requested dark mode, while refining some elements of the navigation, better differentiating level 1 and 2, and lots of small details…
WBD and inFlow
A few months later, Warner Media and Discovery merged, which lead to a new Reorg and new directives, indicating that we were now going to use most Discovery tools as foundation of our new system.
So I went back to the drawing board, and started by analyze inFlow, the tool that was going to be the basis of everything.
inFlow was the operational tool used by European teams like Eurosport, so I worked with them.
I knew that Event operation had different processes and tools across teams, so we decided to expand the capabilities of inFlow by adding what was missing, compared to the tools used at iStreamPlanet.
inFlow operators used a less sophisticated approach because of their teams were structured. At iSP operators are extremely technical and do a good part of the monitoring activities, and that team model was chosen for Max.
So we basically needed to adapt Europeans tools with an American process!
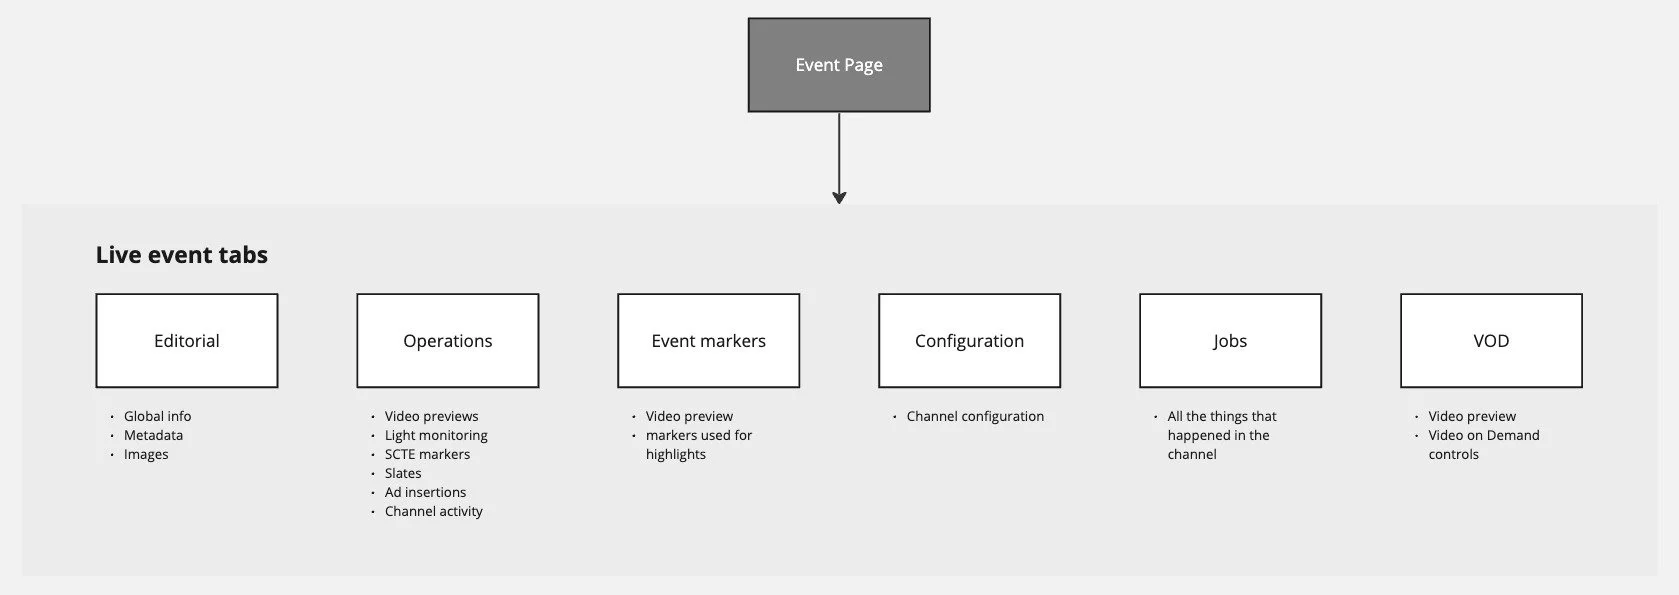
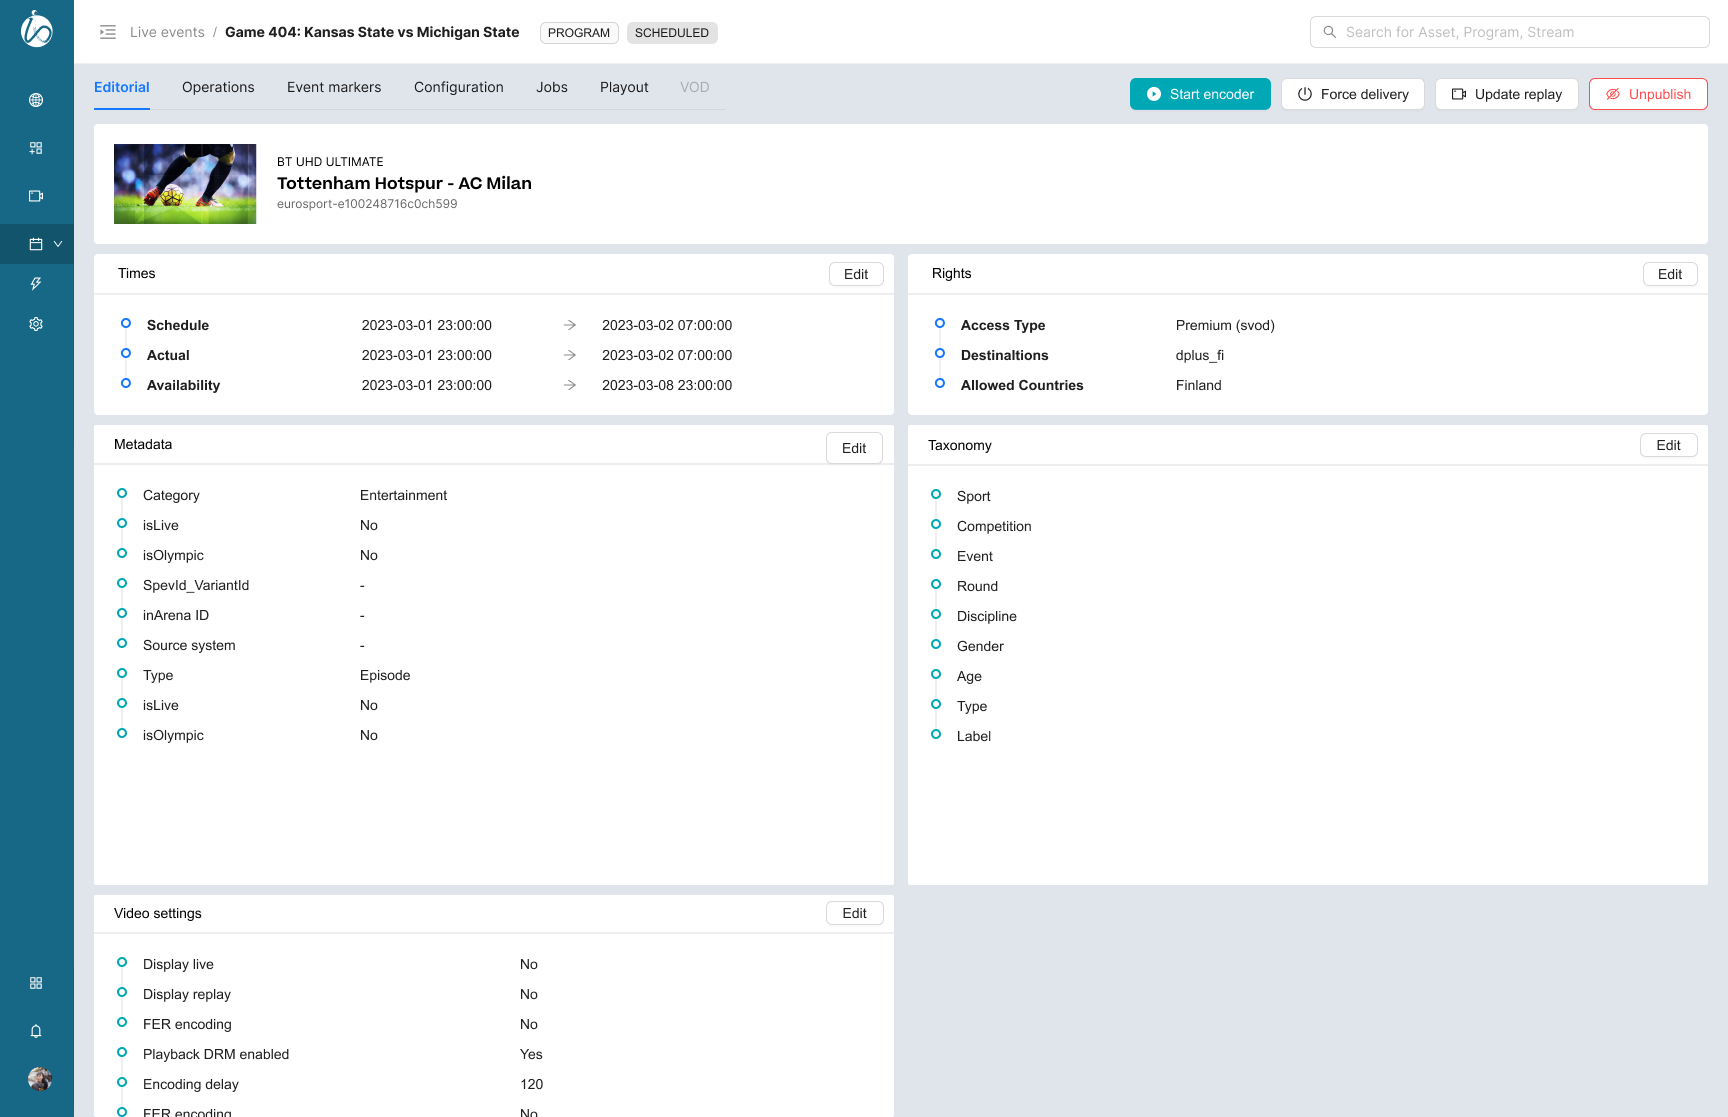
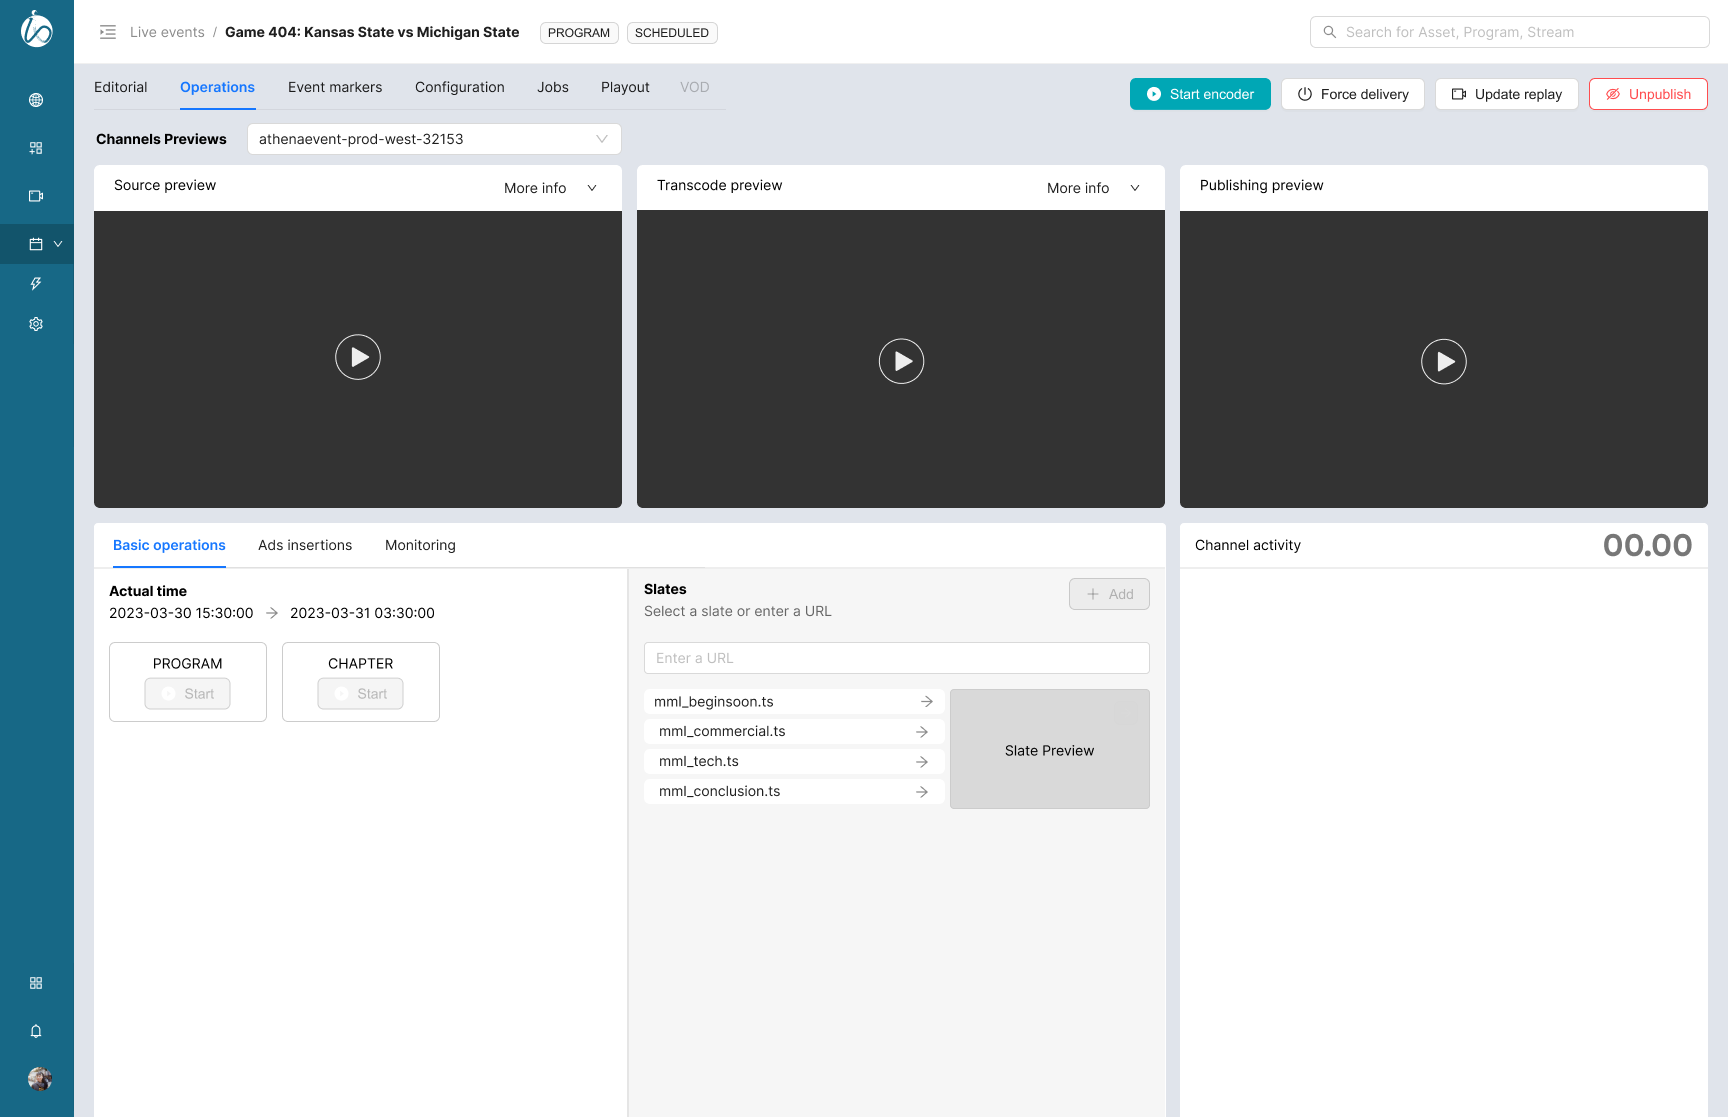
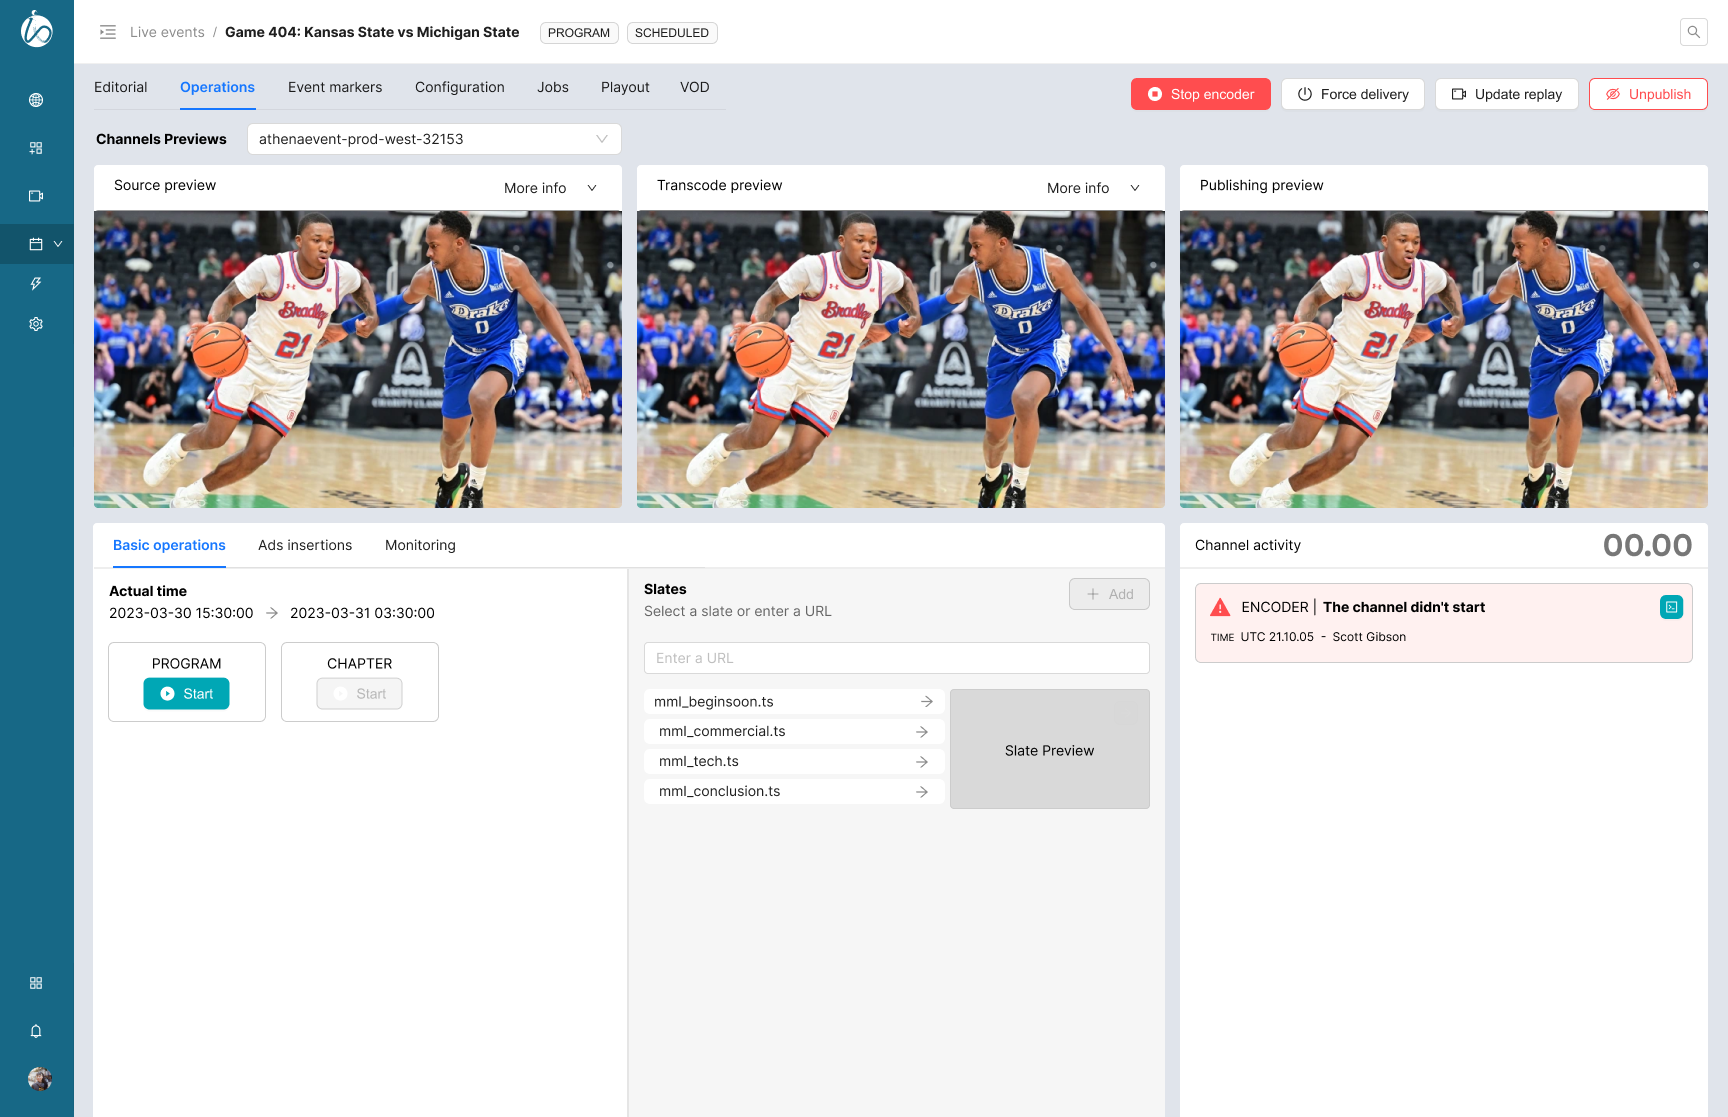
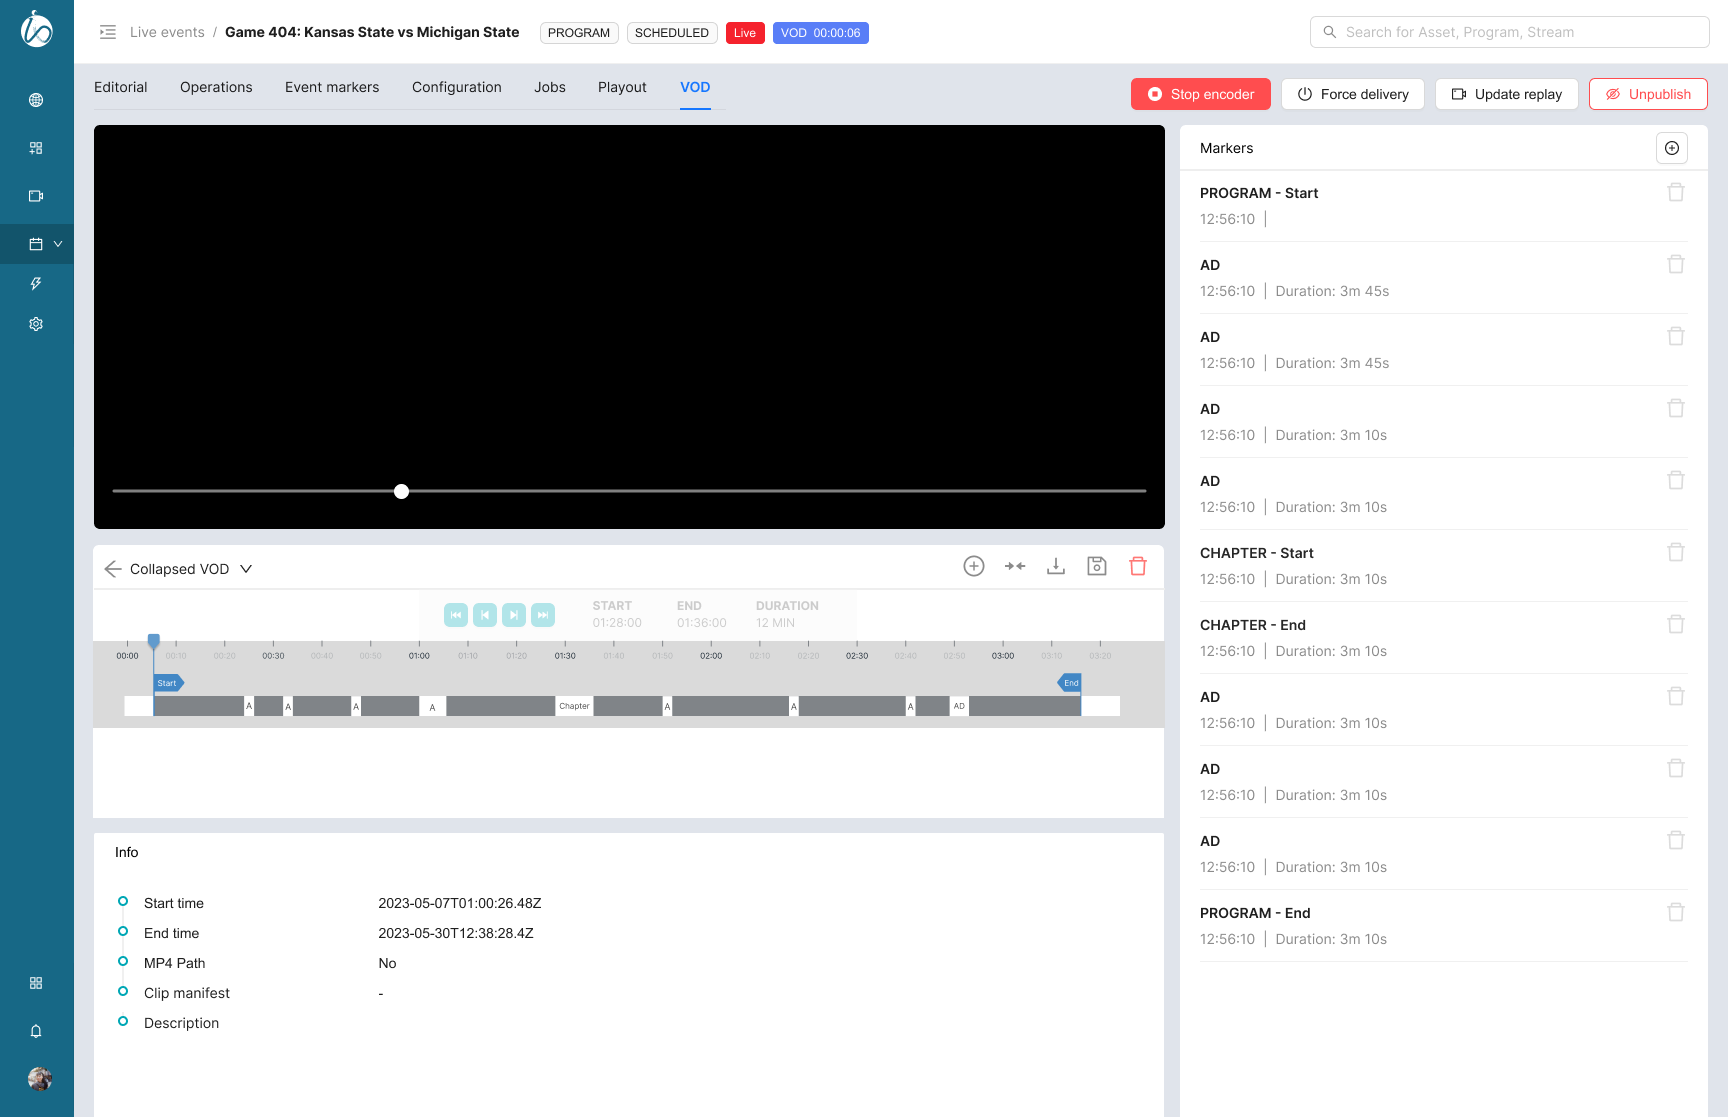
In inFlow the event page is the correspondant of a channel page in the VSS portal, so we added the missing components such as monitoring, slating using the SCTE-35 protocol, ad insertions, and Live 2 VOD editing…
A couple of design decisions
I had to change a lot of things in how users performed their work with this new design. Here are two examples.
Basic operations
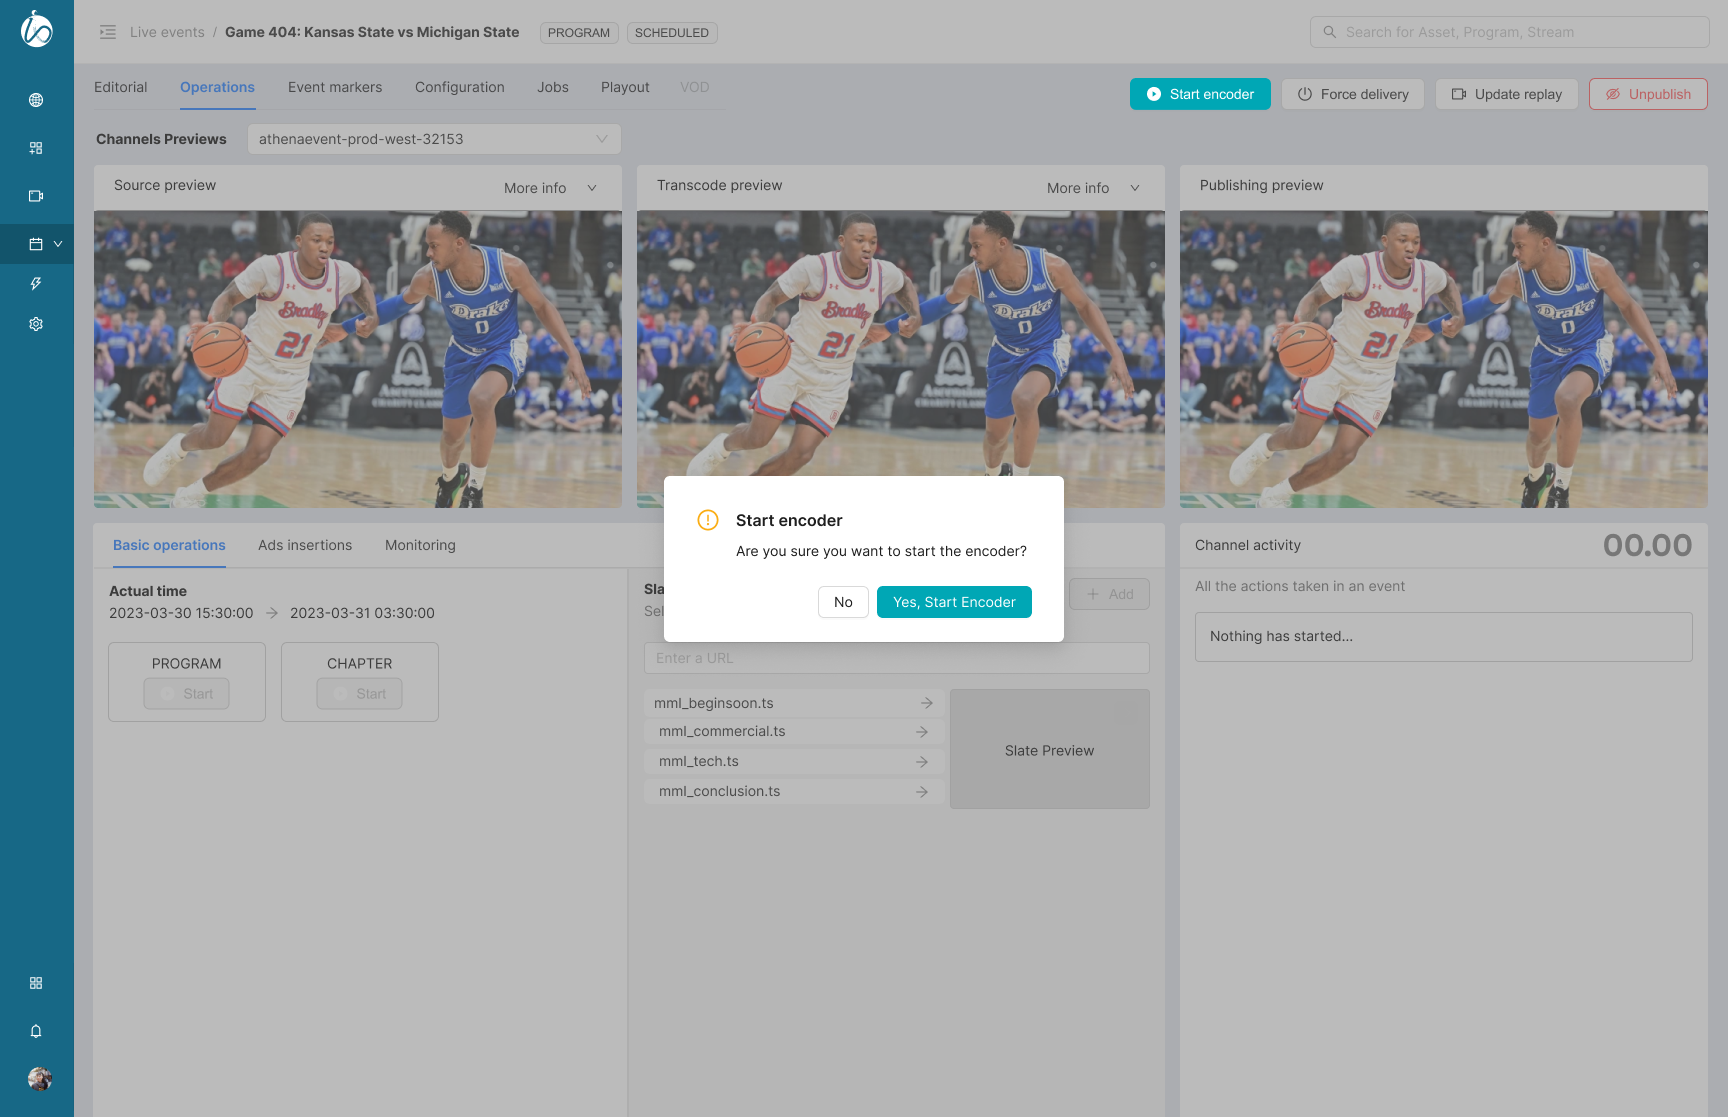
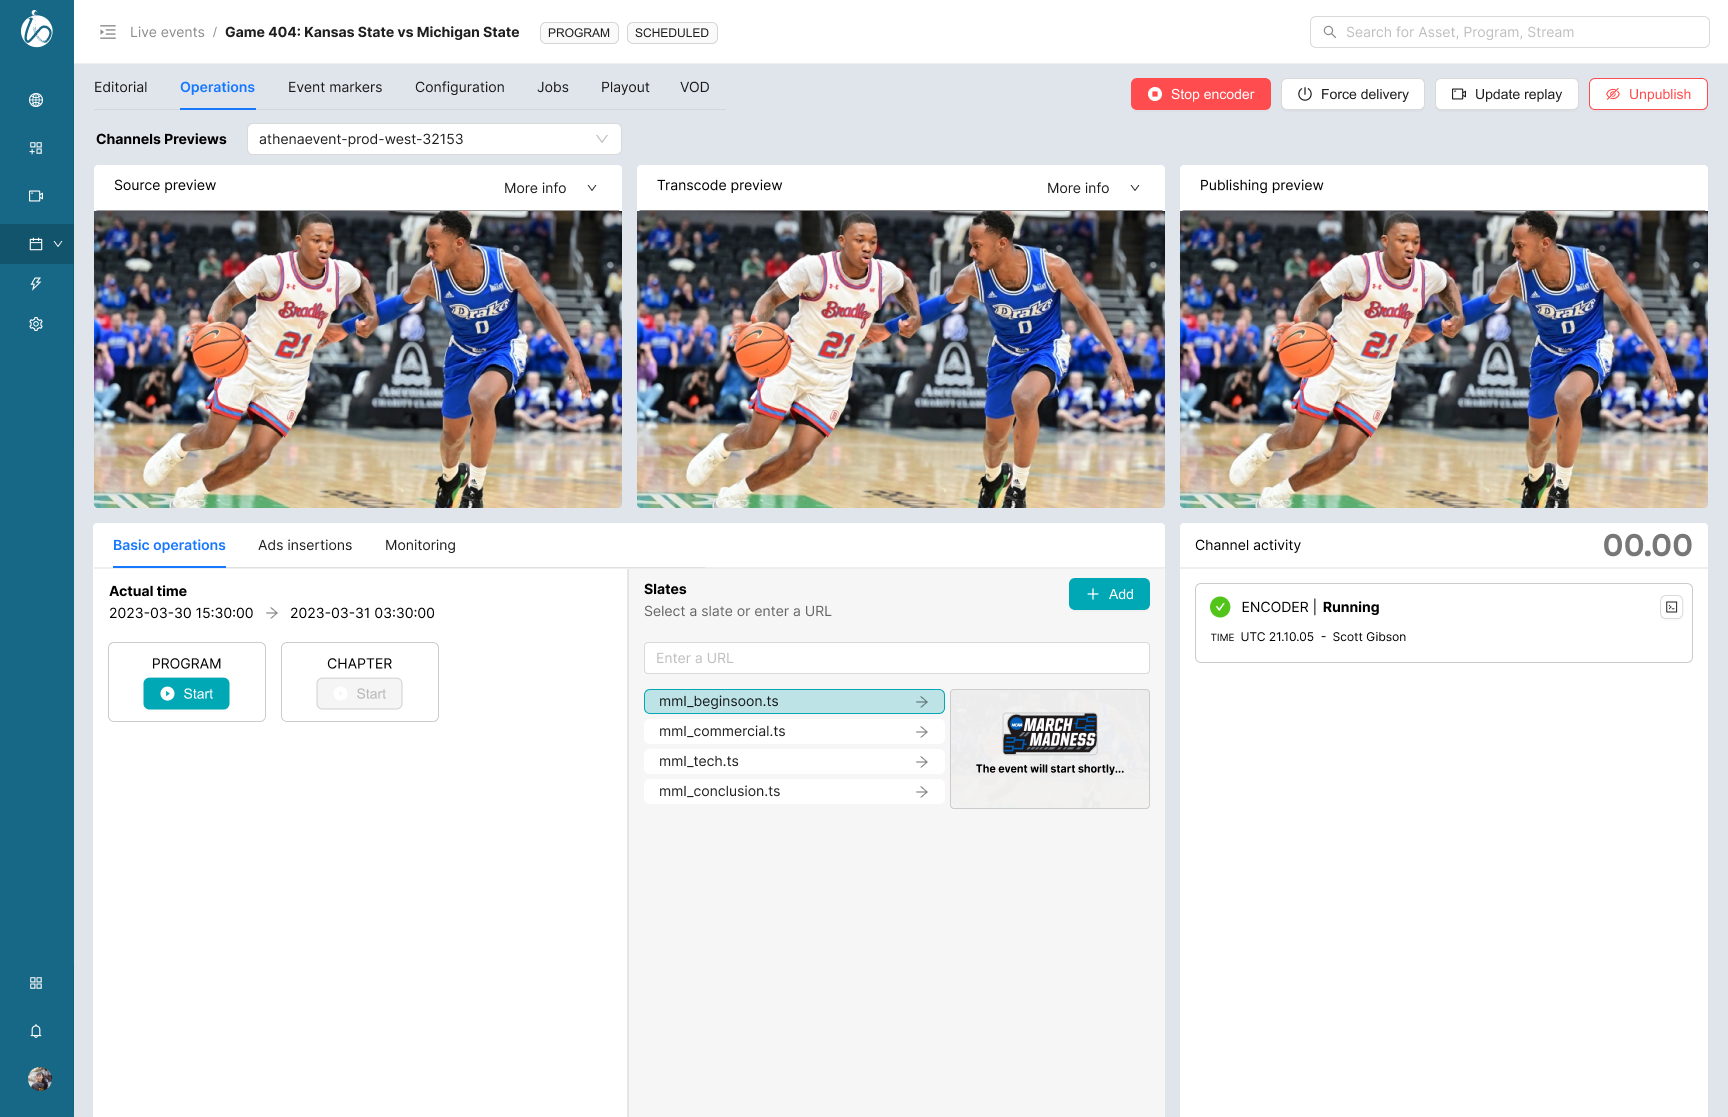
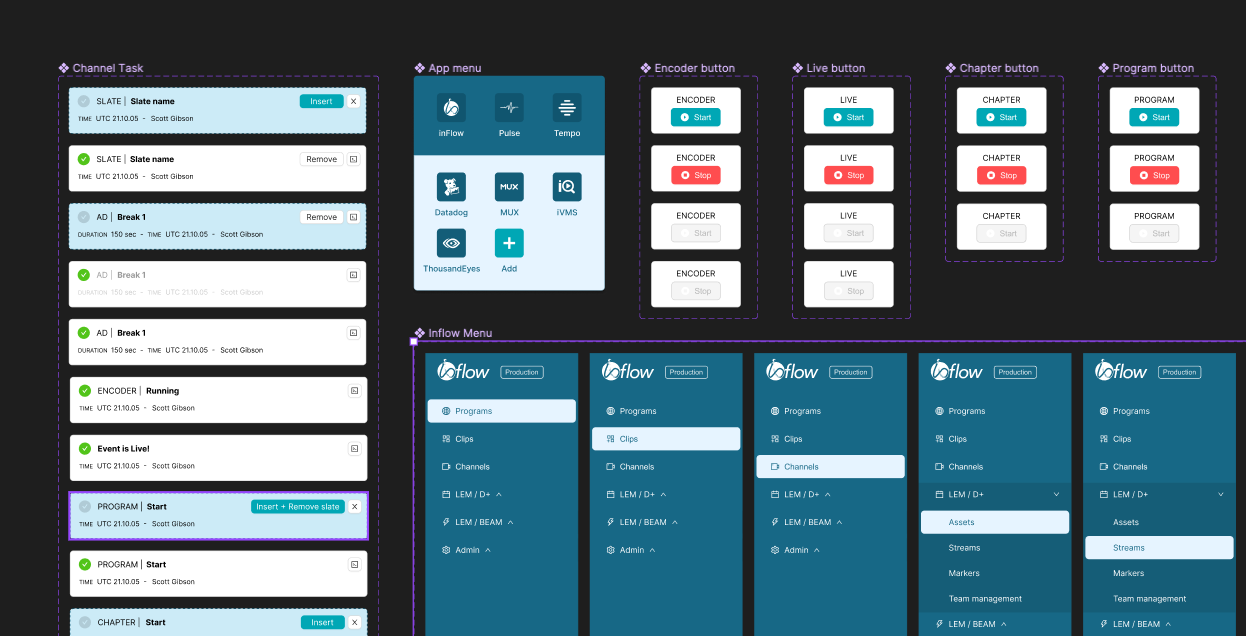
Between the beginning and the end of an event, operators need to perform a series of “basic” operations, such as start/stop an encoder, start/stop a program, start/stop a chapter, and insert/remove slates. During research sessions (which also involved demos and shadowing event sessions) I found out that in most situations the teams needed to use at least two different tools to perform these actions, without any good reasons. This design solves this issue.
Channel activity
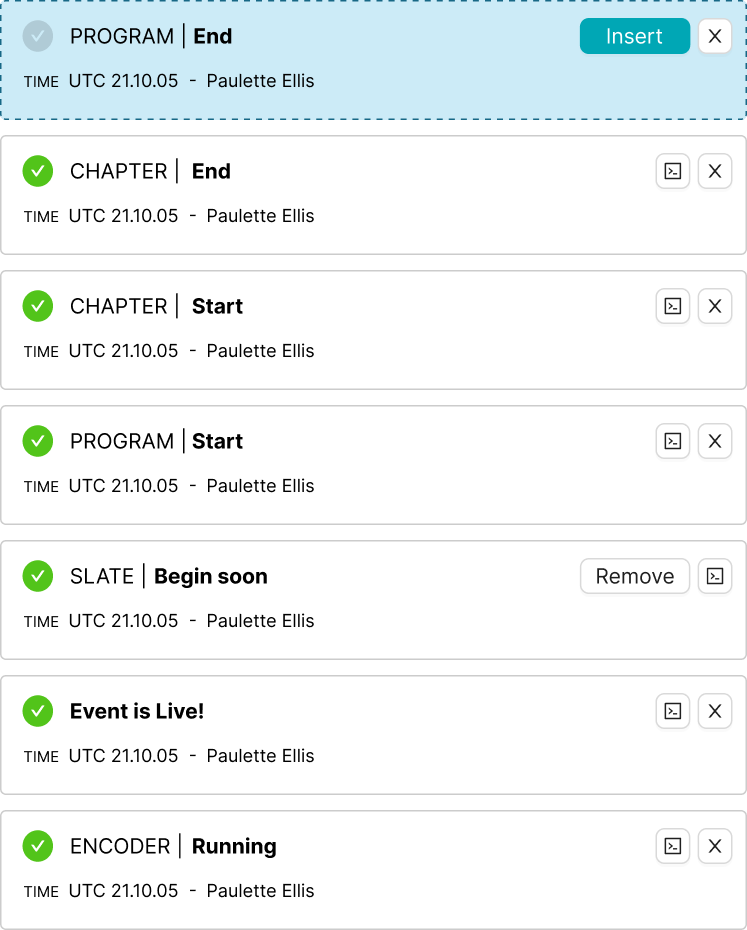
Operators typically run events in pairs, and with the existing solutions, they are not aware of what the other person is doing unless they communicate about it via Slack, Text or Phone. To improve this workflow I created a “channel activity” container, which lists all the operations in real time. I collaborated with engineers to make sure this was feasible.
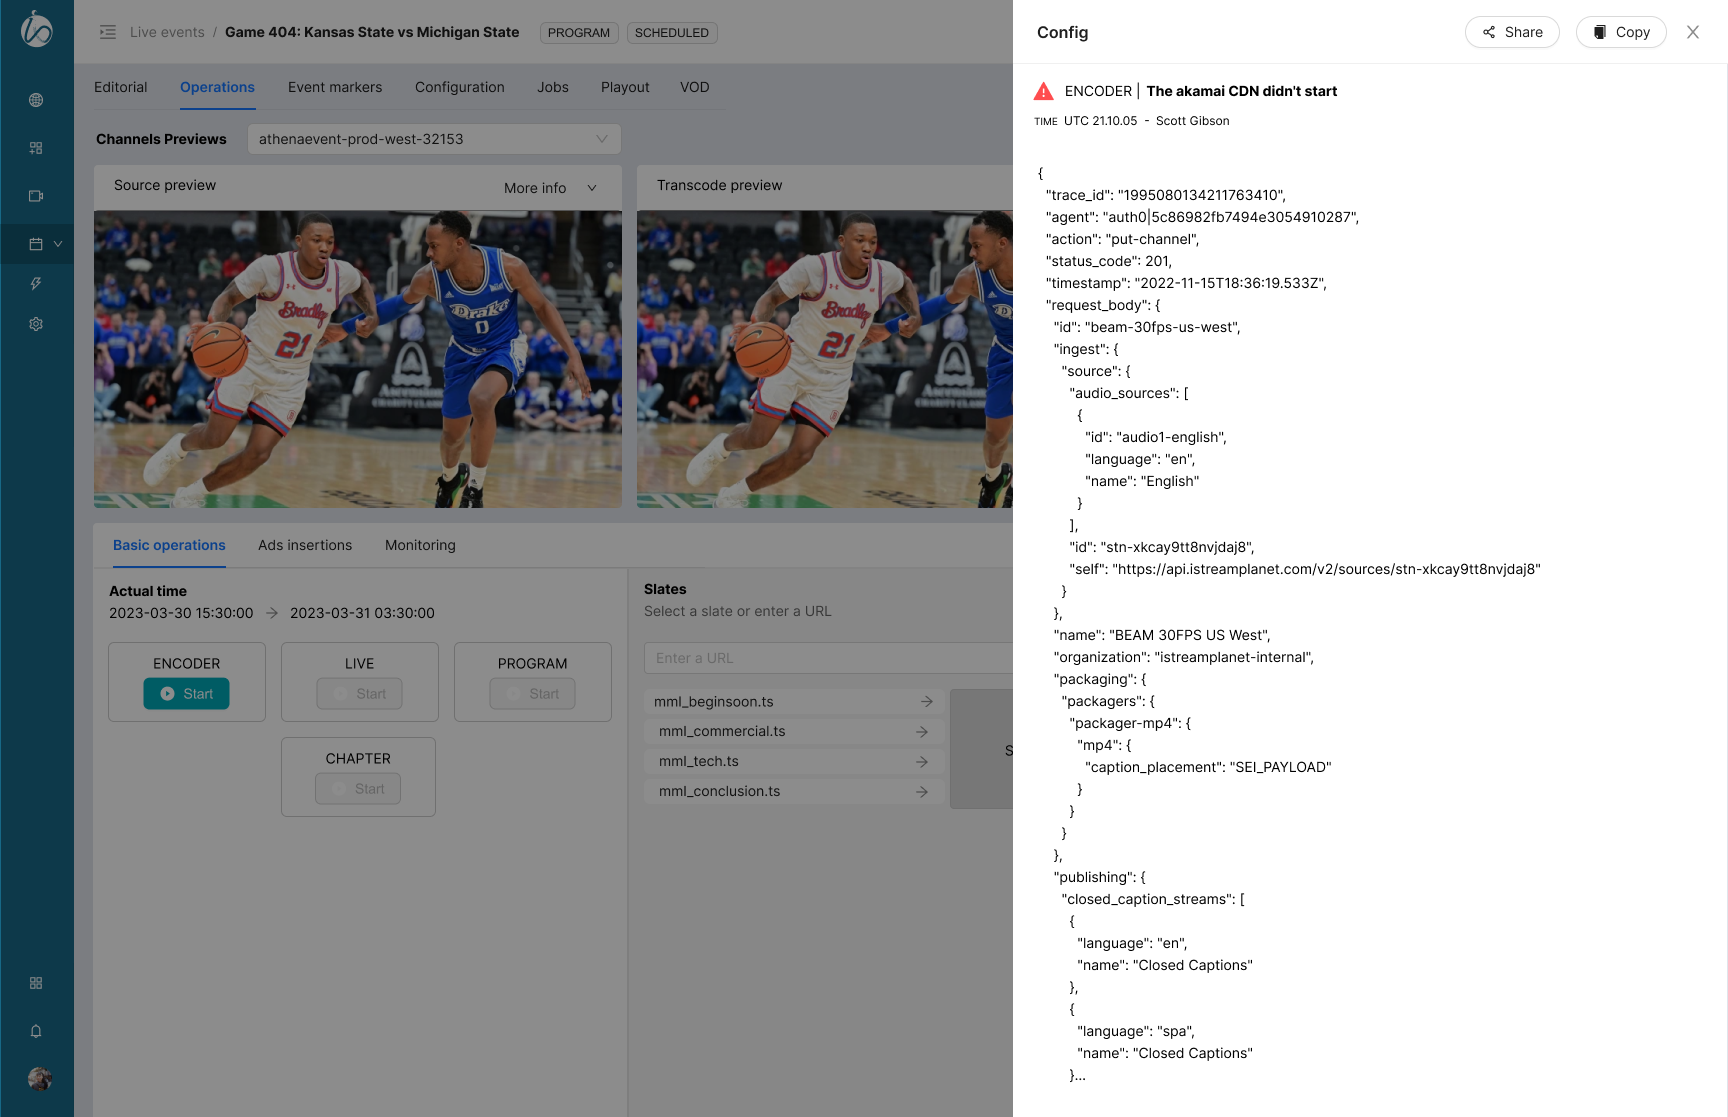
If an error occurs, it will appear there, and users will be able to look at the code on a separate panel (without losing focus of their current tasks).
Additionally, each action happens in two steps, using a “stage mode” so that operators can change an incorrect selection.
Design Language
With the change of tools, we also had to change the design library used. Previously everything was built with MUI. But inFlow used the AntDesign library. So, in our redesign work, we extended this library with new Figma components dedicated to the live operation and monitoring experiences.
Implementation
While I didn’t have the opportunity to see the full implementation I worked with the engineering team on a daily basis.
In this demo, the team is showing an MVP allowing users to perform basic operations and ads (without previews).
Success Metrics
Running more events, with fewer errors were the business metrics we decided to focus on, so in our design, we chose to prioritize:
Operator’s efficiency: total time an operator needs to run an event (between preparation and post event tasks)
Event performance score: including the type and number of errors happening during the event, and the times to communicate and resolve an incident.
Live Streaming Ecosystem
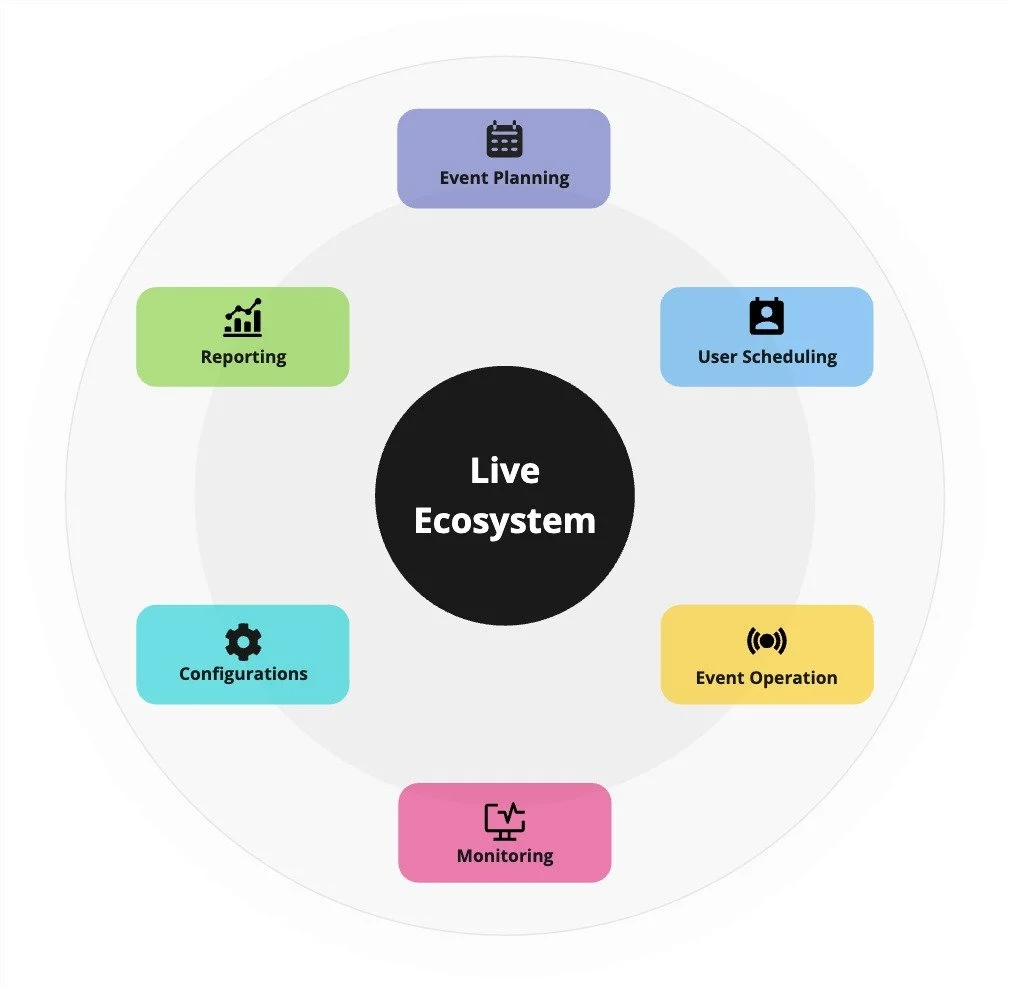
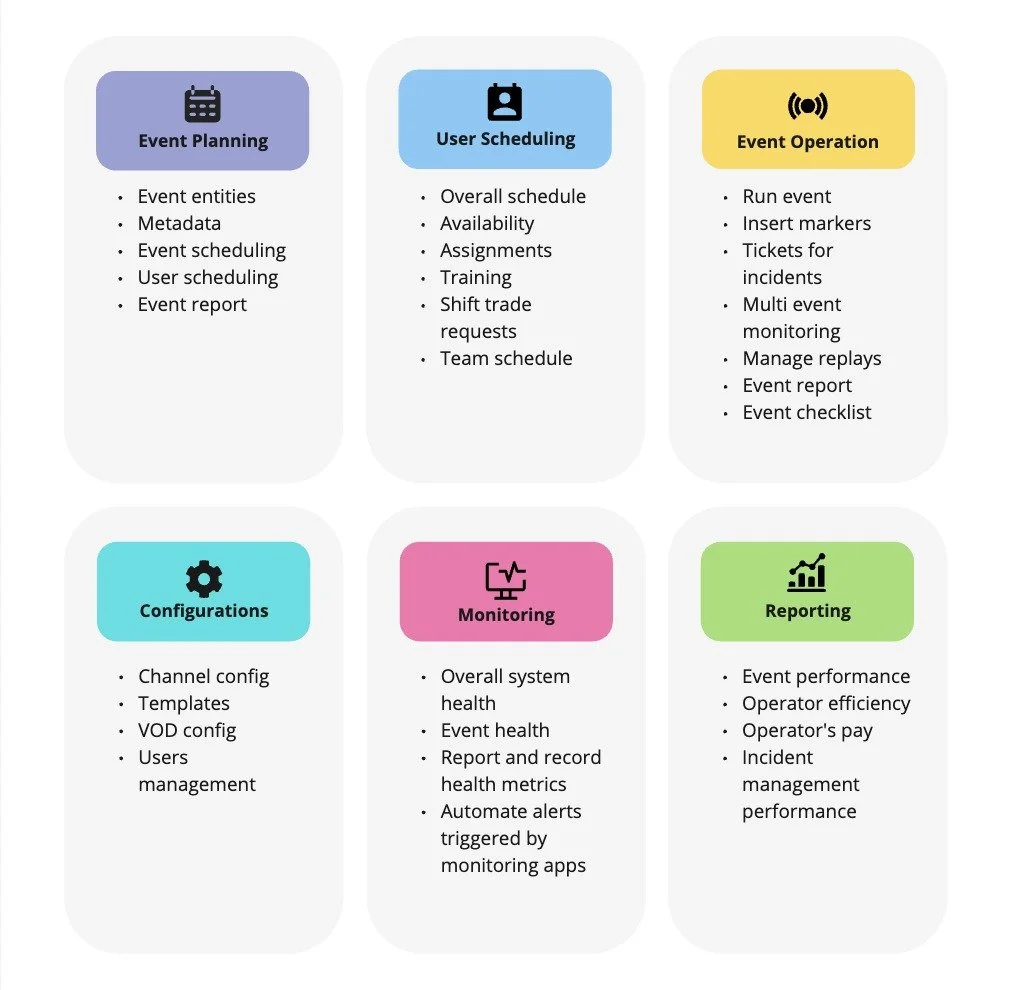
During recurrent participatory sessions with users we developed the idea of an ecosystem aiming at simplifying the entire live event journey from scheduling to reporting. There are currently above fifty applications used across all teams at WBD. This framework will help all teams to consolidate the live experience in one single story encapsulating all use cases.
Future Outlook
The success of this project is a stepping stone towards further innovations in media technology and operations. It underscores my commitment to pioneering design solutions that not only solve immediate challenges but also set new standards for WBD.